Difference between revisions of "229-A2.1"
Jump to navigation
Jump to search
| Line 5: | Line 5: | ||
== Visualizing Nonlinearity == | == Visualizing Nonlinearity == | ||
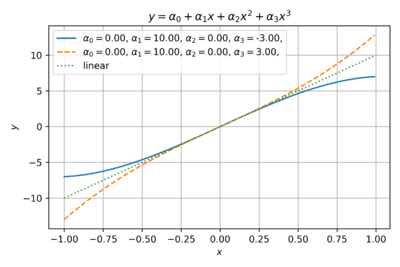
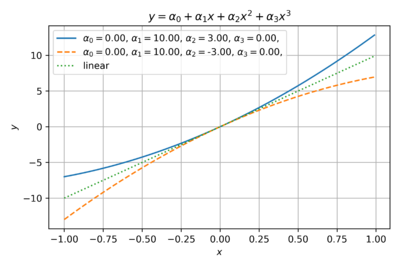
| + | Let us examine the effects of varying the coefficients of the power series model of our transfer function. | ||
| + | |||
{| | {| | ||
| − | |[[File:Odd functions.png|thumb| | + | |[[File:Odd functions.png|thumb|400px|Figure 1: An odd function with positive and negative third order coefficients.]] |
| − | |[[File:Even functions.png|thumb| | + | |[[File:Even functions.png|thumb|400px|Figure 2: An even function with positive and negative second order coefficients.]] |
|- | |- | ||
|} | |} | ||
| − | |||
| − | |||
Revision as of 10:39, 21 September 2020
Activity: Nonlinearity in Circuits
- Instructions: This activity is structured as a tutorial with a design problem at the end. Should you have any questions, clarifications, or issues, please contact your instructor as soon as possible.
- At the end of this activity, the student should be able to:
- Understand and observe the effects of nonlinearity in electronic circuits.
Visualizing Nonlinearity
Let us examine the effects of varying the coefficients of the power series model of our transfer function.

