Difference between revisions of "Filter Basics"
| (24 intermediate revisions by the same user not shown) | |||
| Line 2: | Line 2: | ||
== Filter Types == | == Filter Types == | ||
| − | + | As shown in Figs. 1-5, we can classify filters based on frequency range selectivity as: (1) low-pass filters, (2) high-pass filters, (3) band-pass filters, (4) band-stop, band-reject, or notch filters, and (5) all-pass filters used for phase shaping or ''equalization''. | |
{| | {| | ||
| − | |[[File:LPF.svg|thumb| | + | |[[File:LPF.svg|thumb|175px|Figure 1: Low-pass filter magnitude response and symbol.]] |
| − | |[[File:HPF.svg|thumb| | + | |[[File:HPF.svg|thumb|175px|Figure 2: High-pass filter magnitude response and symbol.]] |
| − | |[[File:BPF.svg|thumb| | + | |[[File:BPF.svg|thumb|175px|Figure 3: Band-pass filter magnitude response and symbol.]] |
| − | |[[File:BSP.svg|thumb| | + | |[[File:BSP.svg|thumb|175px|Figure 4: Band-stop filter magnitude response and symbol.]] |
| − | |[[File:APF.svg|thumb| | + | |[[File:APF.svg|thumb|175px|Figure 5: All-pass filter magnitude response and symbol.]] |
|- | |- | ||
|} | |} | ||
| + | Note that we can easily derive high-pass and band-pass filters from their low-pass equivalents, and thus, even though most of our examples feature low-pass filters, the concepts and ideas are applicable to the other filter types. | ||
== Ideal vs. Practical Filters == | == Ideal vs. Practical Filters == | ||
| + | Let us consider an ideal low-pass filter, whose magnitude response is shown in Fig. 6. This ideal filter response has three properties: (1) it has a flat magnitude in the pass-band, resulting in no amplitude distortion in the signals we are passing, (2) it has a "brick wall" transition region, i.e. the transition between the pass-band and stop-band is abrupt, and (3) it has infinite rejection of out-of-band signals, i.e. zero magnitude response. These characteristics make building an ideal filter rather impractical. | ||
| + | |||
| + | {| | ||
| + | |[[File:Ideal filter.svg|thumb|300px|Figure 6: The ideal low-pass filter magnitude response.]] | ||
| + | |[[File:Practical filter.svg|thumb|300px|Figure 7: A practical low-pass filter magnitude response.]] | ||
| + | |- | ||
| + | |} | ||
| + | |||
| + | A real filter has the following magnitude response properties, as shown in Fig. 7: | ||
| + | # The pass-band could contain ripples, thus causing amplitude distortion in the signals being passed by the filter. | ||
| + | # There is a finite transition region between the pass-band and the stop-band. | ||
| + | # The rejection of stop-band (or out-of-band) signals is finite. | ||
== Magnitude and Frequency Metrics == | == Magnitude and Frequency Metrics == | ||
| + | In the design of filters, we can specify the filter specifications using following parameters, as illustrated in Fig. 8: | ||
| + | ; DC Pass-band Gain, <math>\left|H\left(0\right)\right|</math> | ||
| + | : The value of the magnitude transfer function at DC or as <math>\omega \rightarrow 0</math>. | ||
| + | ; Corner Frequency, <math>f_\text{stop}</math> | ||
| + | : The corner frequency specification. | ||
| + | ; Stop-band Frequency, <math>f_c</math> | ||
| + | : The stop-band frequency specification. | ||
| + | |||
| + | {| | ||
| + | |[[File:Filter mask.svg|thumb|500px|Figure 8: Filter design specifications.]] | ||
| + | |- | ||
| + | |} | ||
| + | |||
| + | The frequency range from <math>f_c</math> to <math>f_\text{stop}</math> is the '''transition region''' separating the pass-band from the stop-band. Instead of individual separate metrics, another way of detailing the filter specifications is by using '''filter mask''', also shown in Fig. 8. The filter mask is a graphical representation of the allowable values the filter magnitude response can take. | ||
== Group Delay == | == Group Delay == | ||
| + | Aside from the filter magnitude specifications, the filter phase response is also a critical parameter, and we would like to determine the how the phase affects the overall behavior of the filter. Consider a filter with transfer function <math>G\left(j\omega\right)=\left|G\left(j\omega\right)\right|\cdot e^{j\cdot \theta\left(\omega\right)}</math>, as shown in Fig. 9. | ||
| + | |||
| + | {| | ||
| + | |[[File:Filter 2port.svg|thumb|300px|Figure 9: A 2-port representation of a filter.]] | ||
| + | |- | ||
| + | |} | ||
| + | |||
| + | Let us apply two sinusoids: | ||
| + | |||
| + | {{NumBlk|::|<math> | ||
| + | v_i\left(t\right)=A_1\sin\left(\omega t\right) + A_2\sin\left[\left(\omega+\Delta \omega\right) t\right] | ||
| + | </math>|{{EquationRef|1}}}} | ||
| + | |||
| + | The output can then be written as: | ||
| + | |||
| + | {{NumBlk|::|<math> | ||
| + | \begin{align} | ||
| + | v_o\left(t\right) & = A_1\cdot \left|G\left(j\omega\right)\right|\cdot \sin\left[\omega t + \theta\left(\omega\right)\right] + A_2\cdot \left|G\left(j\omega+j\Delta \omega\right)\right|\cdot \sin\left[\left(\omega+\Delta \omega\right) t+ \theta\left(\omega+\Delta \omega\right)\right]\\ | ||
| + | & = A_1\cdot \left|G\left(j\omega\right)\right|\cdot \sin\left[\omega \left(t + \frac{\theta\left(\omega\right)}{\omega}\right)\right] + A_2\cdot \left|G\left(j\omega+j\Delta \omega\right)\right|\cdot \sin\left[\left(\omega+\Delta \omega\right)\left( t+ \frac{\theta\left(\omega+\Delta \omega\right)}{\omega+\Delta \omega}\right)\right] | ||
| + | \end{align} | ||
| + | </math>|{{EquationRef|2}}}} | ||
| + | |||
| + | Note that the sinusoid at <math>\left(\omega + \Delta\omega\right)</math> is delayed differently from the sinusoid at <math>\omega</math>, resulting in '''phase distortion'''. | ||
| + | |||
| + | Recall that <math>f\left(x+\Delta x\right)\approx f\left(x\right) + \frac{\partial f\left(x\right)}{\partial x}\cdot \Delta x</math>, thus we can write: | ||
| + | |||
| + | {{NumBlk|::|<math> | ||
| + | \theta\left(\omega+\Delta \omega\right)\approx \theta\left(\omega\right) + \frac{\partial \theta\left(\omega\right)}{\partial \omega}\cdot \Delta \omega | ||
| + | </math>|{{EquationRef|3}}}} | ||
| + | |||
| + | And also: | ||
| + | |||
| + | {{NumBlk|::|<math> | ||
| + | \frac{1}{\omega + \Delta \omega} \approx \frac{1}{\omega} + \left(-\frac{1}{\omega^2}\right)\cdot \Delta \omega \approx \frac{1}{\omega}\cdot\left(1-\frac{\Delta \omega}{\omega}\right) | ||
| + | </math>|{{EquationRef|4}}}} | ||
| + | |||
| + | Thus: | ||
| + | |||
| + | {{NumBlk|::|<math> | ||
| + | \begin{align} | ||
| + | \frac{\theta\left(\omega + \Delta\omega\right)}{\omega + \Delta\omega} & \approx \left[ \theta \left( \omega \right) + \frac{\partial \theta\left(\omega\right)}{\partial \omega}\cdot \Delta \omega\right] \cdot \left[\frac{1}{\omega}\left(1-\frac{\Delta \omega}{\omega}\right) \right]\\ | ||
| + | & \approx \frac{\theta\left(\omega\right)}{\omega} + \frac{\partial \theta\left(\omega\right)}{\partial \omega}\cdot \frac{\Delta \omega}{\omega} - \frac{\theta\left(\omega\right)}{\omega}\cdot\frac{\Delta \omega}{\omega}\\ | ||
| + | & \approx \frac{\theta\left(\omega\right)}{\omega} + \left(\frac{\partial \theta\left(\omega\right)}{\partial \omega} - \frac{\theta\left(\omega\right)}{\omega}\right)\cdot\frac{\Delta \omega}{\omega} | ||
| + | \end{align} | ||
| + | </math>|{{EquationRef|5}}}} | ||
| + | |||
| + | We can then write the output as: | ||
| + | |||
| + | {{NumBlk|::|<math> | ||
| + | \begin{align} | ||
| + | v_o\left(t\right) & = A_1\cdot \left|G\left(j\omega\right)\right|\cdot \sin\left[\omega \left(t + \frac{\theta\left(\omega\right)}{\omega}\right)\right] + A_2\cdot \left|G\left(j\omega+j\Delta \omega\right)\right|\cdot \sin\left[\left(\omega+\Delta \omega\right)\left( t+ \frac{\theta\left(\omega+\Delta \omega\right)}{\omega+\Delta \omega}\right)\right]\\ | ||
| + | & = A_1\cdot \left|G\left(j\omega\right)\right|\cdot \sin\left[\omega \left(t + \frac{\theta\left(\omega\right)}{\omega}\right)\right] + A_2\cdot \left|G\left(j\omega+j\Delta \omega\right)\right|\cdot \sin\left[\left(\omega+\Delta \omega\right)\left( t+ \frac{\theta\left(\omega\right)}{\omega} +\delta\right)\right] | ||
| + | \end{align} | ||
| + | </math>|{{EquationRef|6}}}} | ||
| + | |||
| + | Where: | ||
| + | |||
| + | {{NumBlk|::|<math> | ||
| + | \delta = \left(\frac{\partial \theta\left(\omega\right)}{\partial \omega} - \frac{\theta\left(\omega\right)}{\omega}\right)\cdot\frac{\Delta \omega}{\omega} | ||
| + | </math>|{{EquationRef|7}}}} | ||
| + | |||
| + | Let us define '''phase delay''', <math>\tau_{PD}</math> as: | ||
| + | |||
| + | {{NumBlk|::|<math> | ||
| + | \tau_{PD} = -\frac{\theta\left(\omega\right)}{\omega} | ||
| + | </math>|{{EquationRef|8}}}} | ||
| + | |||
| + | Note that if <math>\delta = 0</math>, both sinusoids will be delayed in time by <math>\tau_{PD}</math>, preserving the relative delays of the input sinusoids. If <math>\delta \ne 0</math>, the output at <math>\left(\omega + \Delta \omega \right)</math> will be time shifted differently than the output at <math>\omega</math>, leading to ''phase distortion''. | ||
| + | |||
| + | To avoid phase distortion, we need to set <math>\delta = 0</math>, or equivalently: | ||
| + | |||
| + | {{NumBlk|::|<math> | ||
| + | \frac{\partial \theta\left(\omega\right)}{\partial \omega} - \frac{\theta\left(\omega\right)}{\omega} = 0 | ||
| + | </math>|{{EquationRef|9}}}} | ||
| + | |||
| + | Thus, solving the differential equation above, we get <math>\theta\left(\omega\right)=k\cdot \omega</math>, where <math>k</math> is a constant. | ||
| + | |||
| + | Let us further define '''group delay''', <math>\tau_{GR}</math> as: | ||
| + | |||
| + | {{NumBlk|::|<math> | ||
| + | \tau_{GR} = -\frac{\partial \theta\left(\omega\right)}{\partial \omega} | ||
| + | </math>|{{EquationRef|10}}}} | ||
| + | |||
| + | Filters with <math>\theta\left(\omega\right)=k\cdot \omega</math>, or equivalently, <math>\tau_{GR}=\tau_{PD}=-k</math>, are called '''linear phase filters''', and these filters do not introduce phase distortion. Note that filters with <math>\theta\left(\omega\right)=k\cdot \omega + C</math>, where <math>C</math> is a constant, are also linear phase filters but are NOT free of phase distortion. Further note that if <math>\left|G\left(j\omega\right)\right| = \left|G\left(j\omega+j\Delta \omega\right)\right|</math>, then we can say that there is no signal magnitude distortion. In most cases, these ideal conditions of no phase or magnitude distortion are not exactly realizable. | ||
Latest revision as of 15:02, 15 March 2021
Filtering is the oldest and most common type of signal processing, usually in the form of frequency selectivity or phase shaping, or both. Some filter applications include (1) extracting a desired signal from other signals, (2) separating signals from noise, (3) anti-aliasing in analog-to-digital converters or smoothing in digital-to-analog converters, (4) phase equalization, and (5) limiting amplifier bandwidths for reducing noise.
Contents
Filter Types
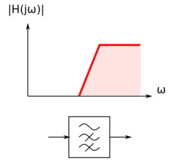
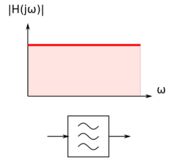
As shown in Figs. 1-5, we can classify filters based on frequency range selectivity as: (1) low-pass filters, (2) high-pass filters, (3) band-pass filters, (4) band-stop, band-reject, or notch filters, and (5) all-pass filters used for phase shaping or equalization.
Note that we can easily derive high-pass and band-pass filters from their low-pass equivalents, and thus, even though most of our examples feature low-pass filters, the concepts and ideas are applicable to the other filter types.
Ideal vs. Practical Filters
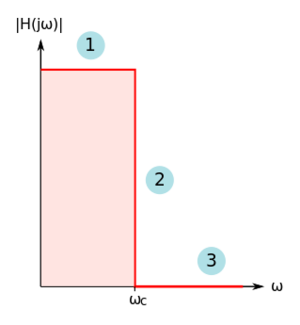
Let us consider an ideal low-pass filter, whose magnitude response is shown in Fig. 6. This ideal filter response has three properties: (1) it has a flat magnitude in the pass-band, resulting in no amplitude distortion in the signals we are passing, (2) it has a "brick wall" transition region, i.e. the transition between the pass-band and stop-band is abrupt, and (3) it has infinite rejection of out-of-band signals, i.e. zero magnitude response. These characteristics make building an ideal filter rather impractical.
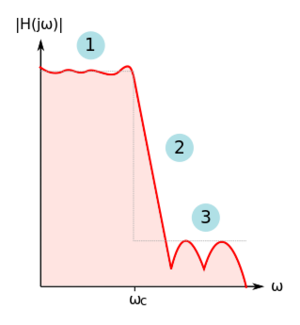
A real filter has the following magnitude response properties, as shown in Fig. 7:
- The pass-band could contain ripples, thus causing amplitude distortion in the signals being passed by the filter.
- There is a finite transition region between the pass-band and the stop-band.
- The rejection of stop-band (or out-of-band) signals is finite.
Magnitude and Frequency Metrics
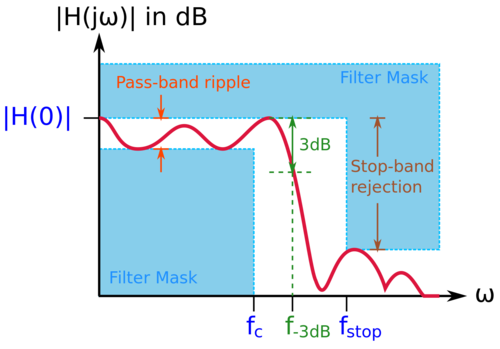
In the design of filters, we can specify the filter specifications using following parameters, as illustrated in Fig. 8:
- DC Pass-band Gain,
- The value of the magnitude transfer function at DC or as .
- Corner Frequency,
- The corner frequency specification.
- Stop-band Frequency,
- The stop-band frequency specification.
The frequency range from to is the transition region separating the pass-band from the stop-band. Instead of individual separate metrics, another way of detailing the filter specifications is by using filter mask, also shown in Fig. 8. The filter mask is a graphical representation of the allowable values the filter magnitude response can take.
Group Delay
Aside from the filter magnitude specifications, the filter phase response is also a critical parameter, and we would like to determine the how the phase affects the overall behavior of the filter. Consider a filter with transfer function , as shown in Fig. 9.
Let us apply two sinusoids:
-
(1)
-
The output can then be written as:
-
(2)
-
Note that the sinusoid at is delayed differently from the sinusoid at , resulting in phase distortion.
Recall that , thus we can write:
-
(3)
-
And also:
-
(4)
-
Thus:
-
(5)
-
We can then write the output as:
-
(6)
-
Where:
-
(7)
-
Let us define phase delay, as:
-
(8)
-
Note that if , both sinusoids will be delayed in time by , preserving the relative delays of the input sinusoids. If , the output at will be time shifted differently than the output at , leading to phase distortion.
To avoid phase distortion, we need to set , or equivalently:
-
(9)
-
Thus, solving the differential equation above, we get , where is a constant.
Let us further define group delay, as:
-
(10)
-
Filters with , or equivalently, , are called linear phase filters, and these filters do not introduce phase distortion. Note that filters with , where is a constant, are also linear phase filters but are NOT free of phase distortion. Further note that if , then we can say that there is no signal magnitude distortion. In most cases, these ideal conditions of no phase or magnitude distortion are not exactly realizable.







![{\displaystyle v_{i}\left(t\right)=A_{1}\sin \left(\omega t\right)+A_{2}\sin \left[\left(\omega +\Delta \omega \right)t\right]}](https://en.wikipedia.org/api/rest_v1/media/math/render/svg/950d3f7010722bb12c00d7d56dc3422b0bb076ec)
![{\displaystyle {\begin{aligned}v_{o}\left(t\right)&=A_{1}\cdot \left|G\left(j\omega \right)\right|\cdot \sin \left[\omega t+\theta \left(\omega \right)\right]+A_{2}\cdot \left|G\left(j\omega +j\Delta \omega \right)\right|\cdot \sin \left[\left(\omega +\Delta \omega \right)t+\theta \left(\omega +\Delta \omega \right)\right]\\&=A_{1}\cdot \left|G\left(j\omega \right)\right|\cdot \sin \left[\omega \left(t+{\frac {\theta \left(\omega \right)}{\omega }}\right)\right]+A_{2}\cdot \left|G\left(j\omega +j\Delta \omega \right)\right|\cdot \sin \left[\left(\omega +\Delta \omega \right)\left(t+{\frac {\theta \left(\omega +\Delta \omega \right)}{\omega +\Delta \omega }}\right)\right]\end{aligned}}}](https://en.wikipedia.org/api/rest_v1/media/math/render/svg/5d41fdc441a6be067e7bf72f20cd49b68ddc5a5e)


![{\displaystyle {\begin{aligned}{\frac {\theta \left(\omega +\Delta \omega \right)}{\omega +\Delta \omega }}&\approx \left[\theta \left(\omega \right)+{\frac {\partial \theta \left(\omega \right)}{\partial \omega }}\cdot \Delta \omega \right]\cdot \left[{\frac {1}{\omega }}\left(1-{\frac {\Delta \omega }{\omega }}\right)\right]\\&\approx {\frac {\theta \left(\omega \right)}{\omega }}+{\frac {\partial \theta \left(\omega \right)}{\partial \omega }}\cdot {\frac {\Delta \omega }{\omega }}-{\frac {\theta \left(\omega \right)}{\omega }}\cdot {\frac {\Delta \omega }{\omega }}\\&\approx {\frac {\theta \left(\omega \right)}{\omega }}+\left({\frac {\partial \theta \left(\omega \right)}{\partial \omega }}-{\frac {\theta \left(\omega \right)}{\omega }}\right)\cdot {\frac {\Delta \omega }{\omega }}\end{aligned}}}](https://en.wikipedia.org/api/rest_v1/media/math/render/svg/f3aeb303375056997060256f09a56c5ffbe22545)
![{\displaystyle {\begin{aligned}v_{o}\left(t\right)&=A_{1}\cdot \left|G\left(j\omega \right)\right|\cdot \sin \left[\omega \left(t+{\frac {\theta \left(\omega \right)}{\omega }}\right)\right]+A_{2}\cdot \left|G\left(j\omega +j\Delta \omega \right)\right|\cdot \sin \left[\left(\omega +\Delta \omega \right)\left(t+{\frac {\theta \left(\omega +\Delta \omega \right)}{\omega +\Delta \omega }}\right)\right]\\&=A_{1}\cdot \left|G\left(j\omega \right)\right|\cdot \sin \left[\omega \left(t+{\frac {\theta \left(\omega \right)}{\omega }}\right)\right]+A_{2}\cdot \left|G\left(j\omega +j\Delta \omega \right)\right|\cdot \sin \left[\left(\omega +\Delta \omega \right)\left(t+{\frac {\theta \left(\omega \right)}{\omega }}+\delta \right)\right]\end{aligned}}}](https://en.wikipedia.org/api/rest_v1/media/math/render/svg/cee1c9d359440f1c3c1482b7bd03d52b4f8925c6)


