Difference between revisions of "220-A3.1"
Jump to navigation
Jump to search
| Line 8: | Line 8: | ||
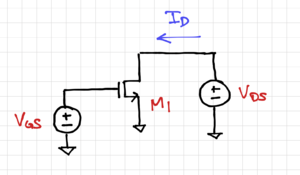
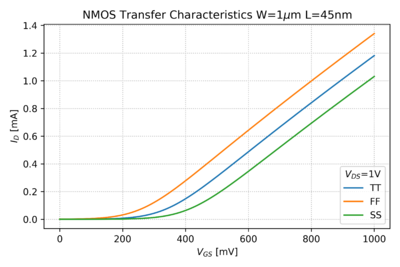
The transfer characteristics of an NMOS transistor is the relationship between the gate-source voltage, which serves as the "input" port of a common-source amplifier, and the "output" drain current. To simulate the transfer characteristic of our 45nm NMOS PTM model, we can use this SPICE file and this Python script. | The transfer characteristics of an NMOS transistor is the relationship between the gate-source voltage, which serves as the "input" port of a common-source amplifier, and the "output" drain current. To simulate the transfer characteristic of our 45nm NMOS PTM model, we can use this SPICE file and this Python script. | ||
| − | + | == Activity 1: MOS Operating Regions == | |
| + | Use the given SPICE file and Python scripts to plot out the NMOS transfer characteristics, as shown in Figs. 2 and 3. Graphically, identify the following regions: | ||
| + | * The quadratic or square-law region | ||
| + | * The velocity saturation region | ||
| + | * The subthreshold or weak inversion region | ||
| + | * The moderate inversion region. | ||
{| | {| | ||
Revision as of 09:46, 16 October 2020
Activity: MOSFET Characteristic Curves
- Instructions: This activity is structured as a tutorial with an activity at the end. Should you have any questions, clarifications, or issues, please contact your instructor as soon as possible.
- At the end of this activity, the student should be able to:
- Generate the characteristic curves of NMOS and PMOS transistors.
Contents
MOS Transfer Characteristics
The transfer characteristics of an NMOS transistor is the relationship between the gate-source voltage, which serves as the "input" port of a common-source amplifier, and the "output" drain current. To simulate the transfer characteristic of our 45nm NMOS PTM model, we can use this SPICE file and this Python script.
Activity 1: MOS Operating Regions
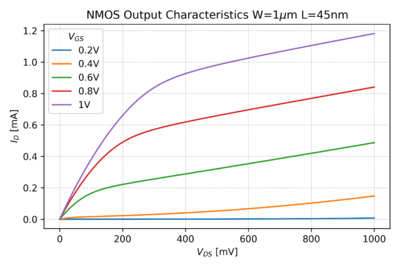
Use the given SPICE file and Python scripts to plot out the NMOS transfer characteristics, as shown in Figs. 2 and 3. Graphically, identify the following regions:
- The quadratic or square-law region
- The velocity saturation region
- The subthreshold or weak inversion region
- The moderate inversion region.
MOS Output Characteristics


