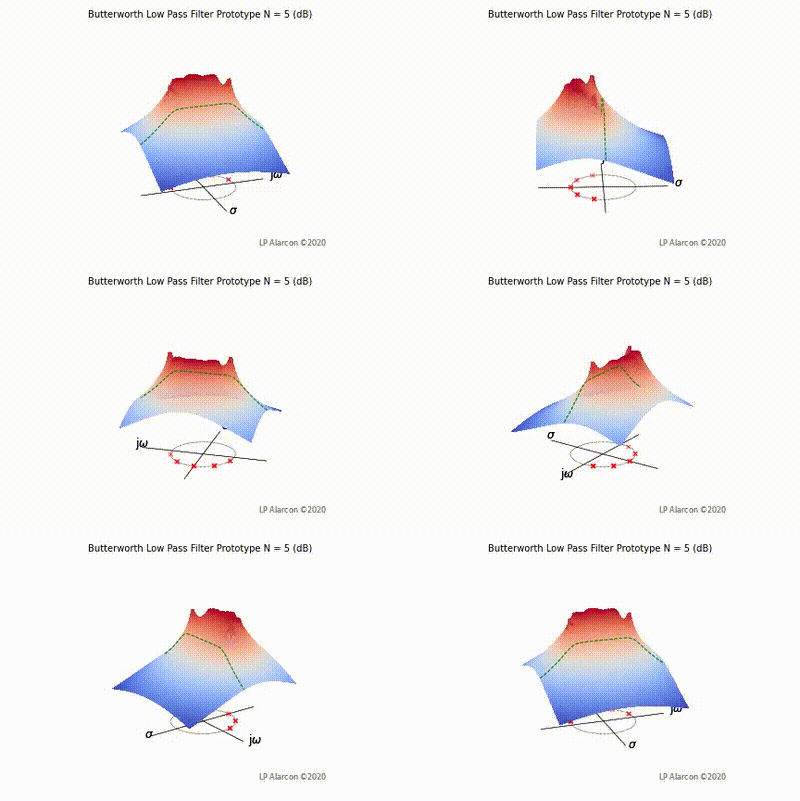
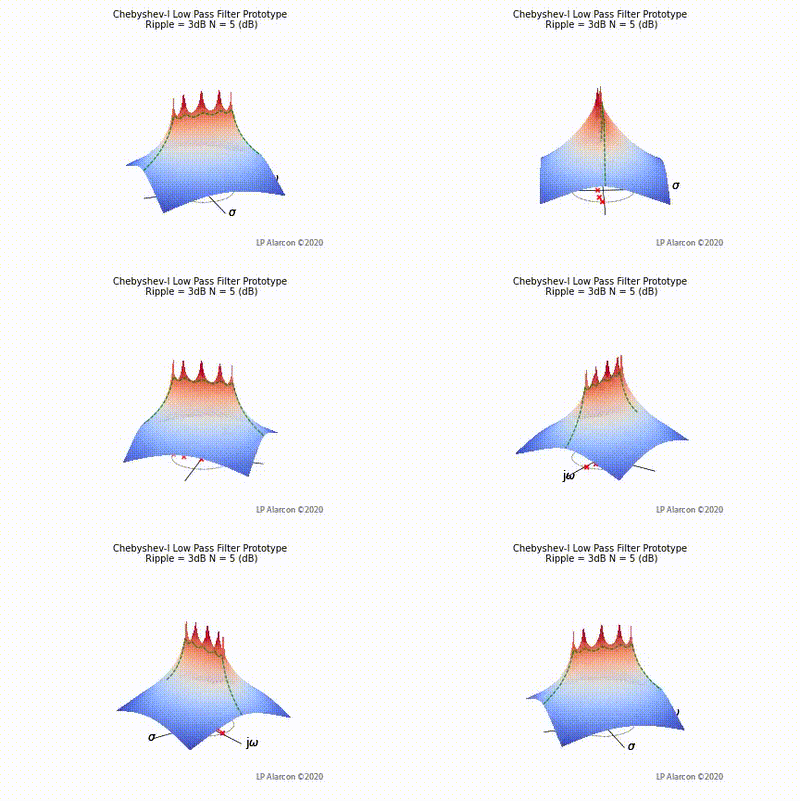
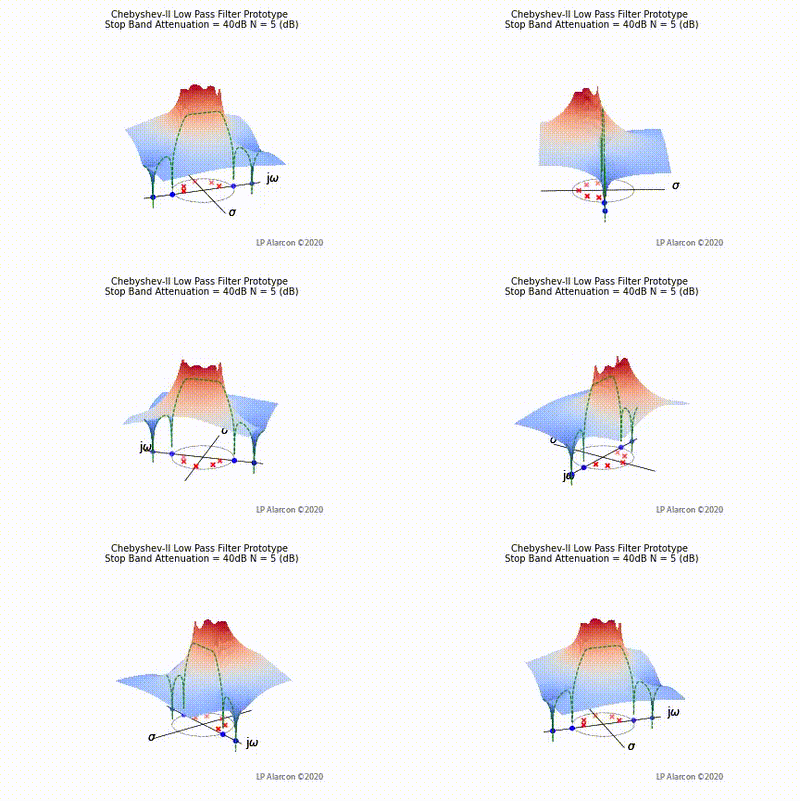
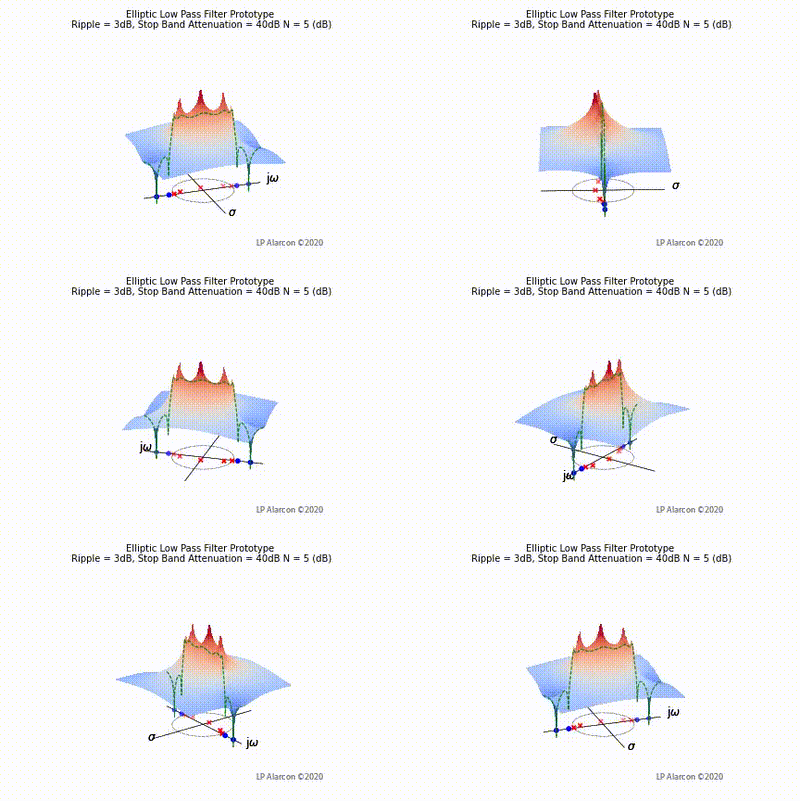
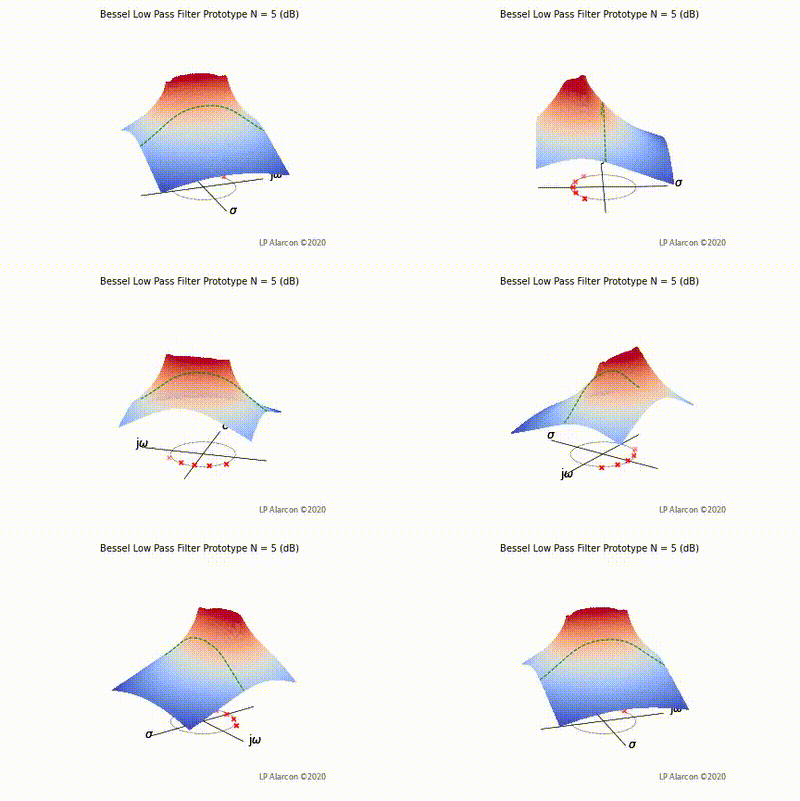
Frequency Response Visualization
Revision as of 00:15, 19 March 2021 by Louis Alarcon (talk | contribs)
The magnitude response of a linear system is the intersection of the magnitude of the transfer function, , in the -plane and the plane containing the -axis, as shown by the dashed green lines in Figs. 1-4. Note that the poles are the values of that makes , and the zeros are values of that result in .


