220-A3.3
Revision as of 22:58, 19 October 2020 by Louis Alarcon (talk | contribs)
Activity: MOS Frequency Response
- Instructions: This activity is structured as a tutorial with an activity at the end. Should you have any questions, clarifications, or issues, please contact your instructor as soon as possible.
- At the end of this activity, the student should be able to:
- Plot the frequency response of NMOS and PMOS transistors.
MOS Transition Frequency
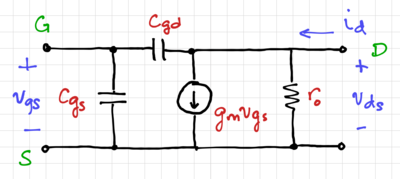
At high frequencies, the MOS gate-to-source capacitance, and the gate-to-drain capacitance, limits the MOSFET current gain at high frequencies, and thus, needs to be included in the two-port model, as shown in Fig. 1. The short-circuit current gain can be expressed as:
-
(1)
-
We then define the transition frequency, as the frequency when magnitude of the short-circuit current gain is equal to 1, or:
-
(2)
-
Thus, we get:
-
(3)
-
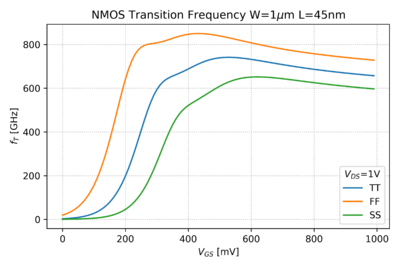
Assuming , we can plot the transition frequency of an NMOS transistor as a function of as shown in Fig. 2, using this SPICE file and Python script.


