Difference between revisions of "220-A3.3"
| (8 intermediate revisions by the same user not shown) | |||
| Line 1: | Line 1: | ||
| − | Activity: '''MOS Frequency | + | Activity: '''MOS Transition Frequency''' |
* '''Instructions''': This activity is structured as a tutorial with an activity at the end. Should you have any questions, clarifications, or issues, please contact your instructor as soon as possible. | * '''Instructions''': This activity is structured as a tutorial with an activity at the end. Should you have any questions, clarifications, or issues, please contact your instructor as soon as possible. | ||
* At the end of this activity, the student should be able to: | * At the end of this activity, the student should be able to: | ||
# Plot the frequency response of NMOS and PMOS transistors. | # Plot the frequency response of NMOS and PMOS transistors. | ||
| − | == MOS | + | == MOS Transition Frequency == |
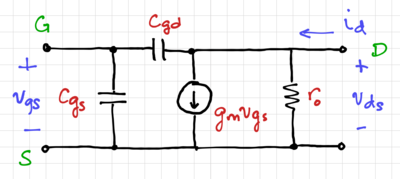
| + | [[File:MOS ss highfreq.png|thumb|400px|Figure 1: The MOS transistor small signal model.]] | ||
| + | At high frequencies, the MOS gate-to-source capacitance, <math>C_{GS}</math> and the gate-to-drain capacitance, <math>C_{GD}</math> limits the MOSFET current gain at high frequencies, and thus, needs to be included in the two-port model, as shown in Fig. 1. The short-circuit current gain can be expressed as: | ||
| + | |||
| + | {{NumBlk|::|<math>A_i=\frac{i_{\mathrm{out}}}{i_{\mathrm{in}}}=\frac{g_m}{j\omega\left(C_{GS}+C_{GD}\right)}</math>|{{EquationRef|1}}}} | ||
| + | |||
| + | We then define the transition frequency, <math>f_T</math> as the frequency when magnitude of the short-circuit current gain is equal to 1, or: | ||
| + | |||
| + | {{NumBlk|::|<math>\left|A_i\right|=\left|\frac{i_{\mathrm{out}}}{i_{\mathrm{in}}}\right|=\frac{g_m}{\omega_T\left(C_{GS}+C_{GD}\right)}=\frac{g_m}{2\pi f_T\left(C_{GS}+C_{GD}\right)}=1</math>|{{EquationRef|2}}}} | ||
| − | == | + | Thus, we get: |
| + | |||
| + | {{NumBlk|::|<math>f_T=\frac{g_m}{2\pi \left(C_{GS}+C_{GD}\right)}</math>|{{EquationRef|3}}}} | ||
| + | |||
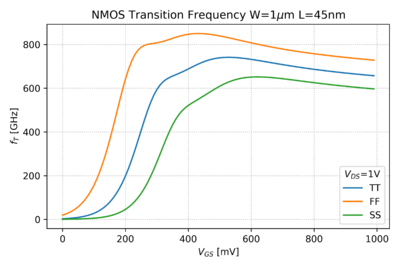
| + | Assuming <math>C_{GD}\ll C_{GS}</math>, we can plot the transition frequency of an NMOS transistor as a function of <math>V_{GS}</math> as shown in Fig. 2, using this SPICE file and Python script. | ||
| + | |||
| + | {| | ||
| + | | [[File:NMOS ft corners.png|thumb|400px|Figure 2: The NMOS Transition Frequency.]] | ||
| + | | [[File:NMOS ft ac vgs=0.5v corners.png|thumb|400px|Figure 3: The Short-Circuit NMOS Current Gain.]] | ||
| + | |- | ||
| + | |} | ||
| + | |||
| + | We can also verify the transition frequency by running an AC analysis. For example, using <math>V_{GS}=0.5\mathrm{V}</math> and <math>V_{DS}=1\mathrm{V}</math>, we can plot the short-circuit current gain, as shown in Fig. 3. Thus, the transition frequency is the frequency when the short-circuit current gain drops to 1, or equivalently 0 dB. | ||
| + | |||
| + | == Activity 1: The MOSFET Transition Frequency == | ||
| + | Compare the results shown in Figs. 2 and 3. Are there any discrepancies in the values of <math>f_T</math>? Perform an AC analysis for a <math>V_{GS}</math> of 0.25V and 0.75V, and comment on the impact of process variation on <math>f_T</math>. Is this what you expected? | ||
| + | |||
| + | == Activity 2: PMOS Transition Frequency == | ||
| + | Generate the PMOS versions of Figs. 2 and 3. For the same size, how does the <math>f_T</math> of the PMOS compare to the NMOS? Comment on the relative values as well as the effect of process variations. | ||
| − | == | + | == Report Guide == |
| + | Write up a 2-3 page report answering the questions above, including the annotated graphs showing the transition frequency of both the NMOS and PMOS transistors, and submit the report via email. | ||
Latest revision as of 23:13, 19 October 2020
Activity: MOS Transition Frequency
- Instructions: This activity is structured as a tutorial with an activity at the end. Should you have any questions, clarifications, or issues, please contact your instructor as soon as possible.
- At the end of this activity, the student should be able to:
- Plot the frequency response of NMOS and PMOS transistors.
Contents
MOS Transition Frequency
At high frequencies, the MOS gate-to-source capacitance, and the gate-to-drain capacitance, limits the MOSFET current gain at high frequencies, and thus, needs to be included in the two-port model, as shown in Fig. 1. The short-circuit current gain can be expressed as:
-
(1)
-
We then define the transition frequency, as the frequency when magnitude of the short-circuit current gain is equal to 1, or:
-
(2)
-
Thus, we get:
-
(3)
-
Assuming , we can plot the transition frequency of an NMOS transistor as a function of as shown in Fig. 2, using this SPICE file and Python script.
We can also verify the transition frequency by running an AC analysis. For example, using and , we can plot the short-circuit current gain, as shown in Fig. 3. Thus, the transition frequency is the frequency when the short-circuit current gain drops to 1, or equivalently 0 dB.
Activity 1: The MOSFET Transition Frequency
Compare the results shown in Figs. 2 and 3. Are there any discrepancies in the values of ? Perform an AC analysis for a of 0.25V and 0.75V, and comment on the impact of process variation on . Is this what you expected?
Activity 2: PMOS Transition Frequency
Generate the PMOS versions of Figs. 2 and 3. For the same size, how does the of the PMOS compare to the NMOS? Comment on the relative values as well as the effect of process variations.
Report Guide
Write up a 2-3 page report answering the questions above, including the annotated graphs showing the transition frequency of both the NMOS and PMOS transistors, and submit the report via email.


