Difference between revisions of "CoE 197U Scaling"
| Line 28: | Line 28: | ||
{| | {| | ||
|[[File:Power and vdd scaling.png|thumb|480px|Figure 5: Supply voltage and power scaling<ref name="kunert2015">B. Kunert, Integration and Application of Epitaxial Systems: III/V on Silicon for Optoelectronics, IMEC Belgium 2015</ref>.]] | |[[File:Power and vdd scaling.png|thumb|480px|Figure 5: Supply voltage and power scaling<ref name="kunert2015">B. Kunert, Integration and Application of Epitaxial Systems: III/V on Silicon for Optoelectronics, IMEC Belgium 2015</ref>.]] | ||
| − | |[[File:Leakage power.png|thumb| | + | |[[File:Leakage power.png|thumb|500px|Figure 6: Active and Leakage Power<ref name="haensch2006">W. Haensch et al., Silicon CMOS devices beyond scaling, ''IBM Journal of Research and Development'', vol. 50, no. 4.5, pp. 339-361, July 2006, doi: 10.1147/rd.504.0339.</ref>.]] |
|- | |- | ||
|} | |} | ||
Revision as of 16:19, 26 February 2021
Contents
Moore's Law
In 1965, Gordon Moore published a 4-page paper entitled "Cramming more components onto integrated circuits"[1], where he predicted that the number of components in an integrated circuit will increase by a factor of two every year, as shown in Fig. 1. Note that he based his extrapolation on just 4 data points!
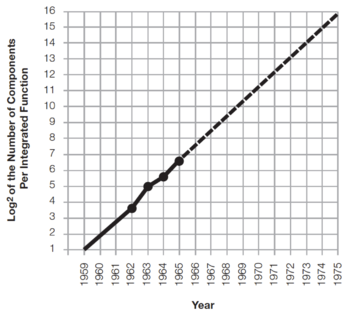 Figure 1: Gordon Moore's 1965 prediction[1]. |
Why is this paper and the graph in Fig. 1 important? Gordon Moore's prediction, also known as Moore's Law, has reflected and, more importantly, driven the steady and rapid progress in computing technology[2]. Thus, satisfying Moore's Law has become the goal instead of being merely a prediction.
Evolution of Complexity
As Gordon Moore predicted, the cost and performance advantage of putting more and more devices into a single integrated circuit (IC) led to the rapid increase in circuit complexity. One convenient indicator of circuit complexity is the number of transistors contained in a single IC.
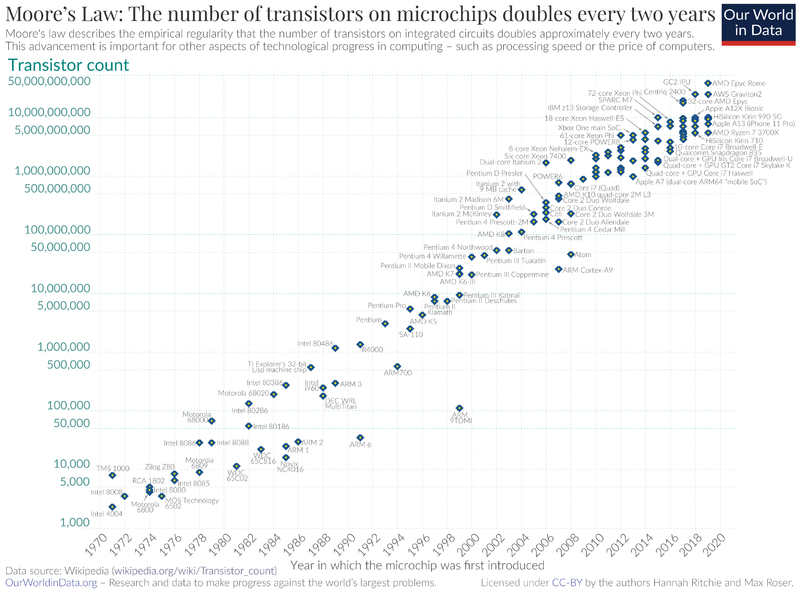 Figure 2: Transistor Count (1970 - 2020)[3]. |
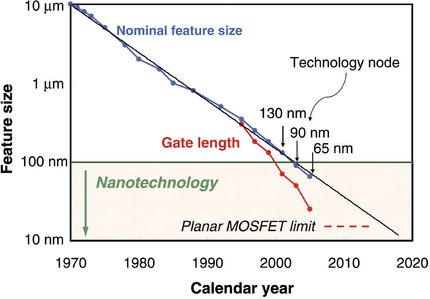 Figure 3: Technology node and transistor gate length versus calendar year[4]. |
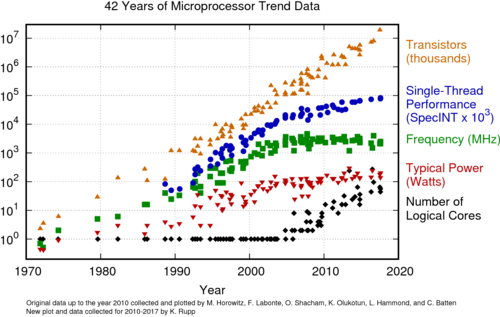 Figure 4: Scaling and processor performance[5]. |
Challenges in Digital Design
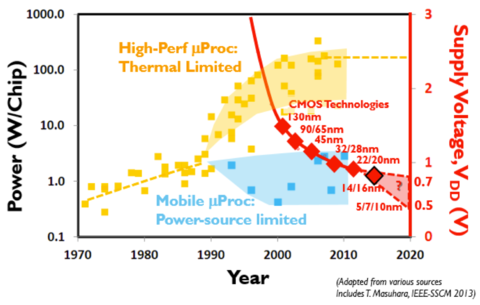 Figure 5: Supply voltage and power scaling[6]. |
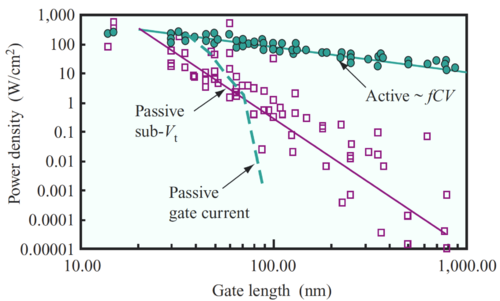 Figure 6: Active and Leakage Power[7]. |
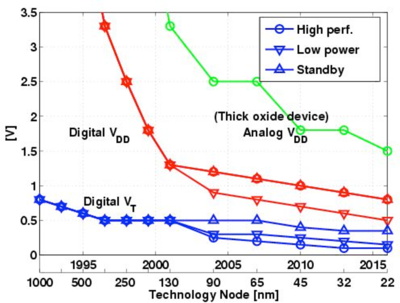 Figure 6: Supply and threshold voltage scaling[8]. |
Why Scale?
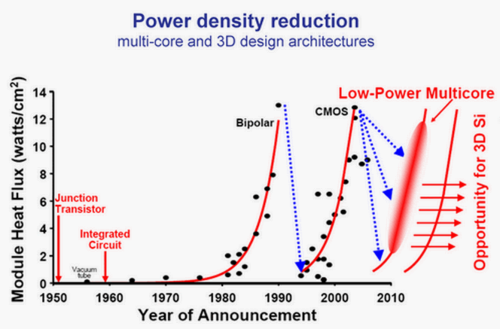 Figure 7: Semiconductor power density[9]. |
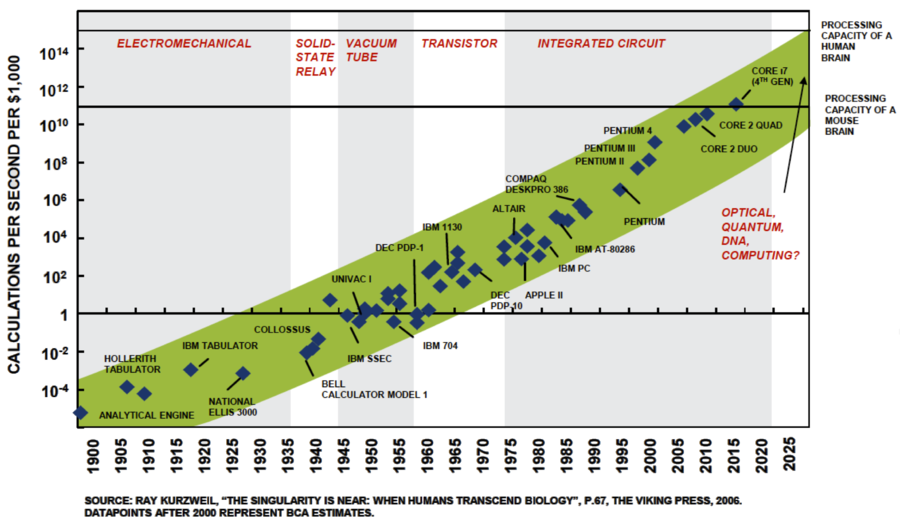 Figure 6: Calculations per second for a fixed cost[10]. |
The Cost of Integrated Circuits
Non-Recurrent Engineering Costs
Recurrent Costs
Yield
References
- ↑ Jump up to: 1.0 1.1 Gordon E Moore, Cramming more components onto integrated circuits, Electronics, Volume 38, Number 8, April 19, 1965 (pdf)
- ↑ Gordon Moore: The Man Whose Name Means Progress, IEEE Spectrum, March 2015.
- ↑ https://upload.wikimedia.org/wikipedia/commons/0/00/Moore%27s_Law_Transistor_Count_1970-2020.png
- ↑ S. E. Thompson, S. Parthasarathy, Moore's law: the future of Si microelectronics, Materials Today, Volume 9, Issue 6, 2006, Pages 20-25. (link)
- ↑ K. Rupp, 42 Years of Microprocessor Trend Data, https://www.karlrupp.net/2018/02/42-years-of-microprocessor-trend-data/
- ↑ B. Kunert, Integration and Application of Epitaxial Systems: III/V on Silicon for Optoelectronics, IMEC Belgium 2015
- ↑ W. Haensch et al., Silicon CMOS devices beyond scaling, IBM Journal of Research and Development, vol. 50, no. 4.5, pp. 339-361, July 2006, doi: 10.1147/rd.504.0339.
- ↑ ITRS, The International Technology Roadmap for Semiconductors (2004 edition), 2004. Technical Report, http://public.itrs.net
- ↑ Chen (IBM), ISS Europe 2007, (link).
- ↑ BCA Research (link).