Channeling your inner capacity
Channel Basics
When Shannon developed his theory of information, it was in the context of improving communication. He wanted to determine if there was a way to maximize the transmission rates over some noisy channel. In this module, we will learn more about the channel and some formal terminologies that we will use in the succeeding modules. The GIF below recalls the story of Bob and Alice. Bob wants to send a message to Alice across some channel. Let's simplify the scenario. Let's say Bob sends a love letter to Alice through some wireless (satellite based) channel.
Figure 2 shows a simplified model of their communication. Bob is the source. Sometimes we use the term sender or transmitter for the source. The medium where the message goes through is the channel (in this case, the wireless channel). Alice is the receiver who probably gets the correct message at the other end of the channel. Let's take a look at each component formally.
The Source
The source is the component that produces messages or objects sent over a channel. We represent the source as a random variable which contains the outcomes and each outcome has its own probability distribution . The random variable is also called the source alphabet and the outcomes are the symbols of the source alphabet. A combinational sequence of symbols forms the message that travels through the channel. Consider the following examples:
- We can let the source alphabet be the English alphabet where the symbols are all the letters from to including the space. Suppose we want to send the message "the quick brown fox jumps over the lazy dog". All letters of the English alphabet has a probability distribution associated with it. We have seen this from our programming exercise in module 2. We extracted the probability distributions of N-block combinations for English, German, French, and Filipino languages.
- We can let be the binary alphabet where the symbols are . The message could be streams of 1s and 0s that represents something. For example, a message could be a sequence of events when a light is on or off. It could also be an indicator that a decimal value was sent in the form of binary digits. Finally, it could represent binary pixels of a fixed-size image.
- In biology, we can let be the DNA bases whose symbols are . is adenine, is cytosine, is guanine, and is thymine. These symbols combine to form DNA sequences that are messages to instruct a cell to do certain types of protein synthesis.
Make sure to understand carefully what source alphabets, symbols, and messages mean.
The Channel
The channel is the medium where the source message travels until it gets to the receiver. In our Bob and Alice example, they used a wireless channel. The maximum capacity of the channel is measured by the number of symbols that can be transmitted per second. We call this the channel capacity. We will discuss this later. Most of the time, we associate channels with noise. A noiseless channel is where the information of the message gets to the receiver "perfectly". That means whatever the source sends gets to the receiver without any glitches or any manipulation of the message's symbols. A noisy channel flips existing symbols of a message or adds unnecessary (or new) symbols that are not originally part of the source alphabet. The noise disrupts the message and thereby affecting the information that the receiver retrieves. We associate the chance of flipping symbols with conditional probabilities. For example, suppose we received a 1 at the receiver's end but the source actually sent a 0. We can model this noise as the probability of receiving a 1 given that a 0 was sent (i.e., ).
Let's take a few examples:
- In the Bob and Alice story, the wireless channel can disrupt Bob's message. Suppose one of the messages Bob sends is "love can be as sweet as smelling the roses". Unfortunately, noise can either corrupt symbols or add unwanted symbols such the the message becomes "love cant bed as sweat as smelting the noses". This is a disaster if it gets to Alice. 😱
- Another example is memory. Suppose you're in Mars and you need to record audio logs and videos on a solid-state drive (SSD). Memories can be corrupted due to cosmic-ray bit flips. These bit flips occur due to cosmic energies that zap some bits of memory. Say some data gets flipped into . Both representations mean totally different things.
- Last example is social media. Good people (source) would like to spread factual news (message) that are noteworthy of broadcasting to ordinary citizens (receivers). Unfortunately, this does not stop evil citizens from creating fake news (noise). Since both factual news and fake news mix together in social media, fake news disrupts the intended messages for ordinary citizens. Don't you hate it when this happens? 😩 Innocent people fall into this trap.
Of course, if the channels were noiseless, the examples above won't have any issues with the received messages. We won't be dealing with the physics of channels in this course.
The Receiver
The receiver, obviously, receives and accepts the message at the other end of the channel. Just like the source, the receiver is a random variable that has outcomes associated to a probability distribution . We can also call as the receiver alphabet with symbols . Observe that we purposely set the maximum number as because it is possible that the receiver may receive more symbols than the source alphabet (i.e., ) when the channel is noisy. A noiseless channel produces where all outcomes and the probability distributions . If the channel is noisy then and either the outcomes or the probability distributions are not equal. Take note that it's possible to have the exact same outcomes but different probability distributions. Let's take a look at some examples:
- From the Bob and Alice example, Bob sent "love can be as sweet as smelling the roses" but Alice received "love cant bed as sweat as smelting the noses". This noisy message shows that some symbols were flipped and some symbols magically appeared. Here, we can show that but the probability distribution of will be different from . Checkout the tabulated data below. We'll leave it up to you how we got these numbers. It should be obvious.
| Outcomes | ||
|---|---|---|
| a | 0.071 | 0.091 |
| b | 0.024 | 0.023 |
| c | 0.024 | 0.023 |
| d | 0 | 0.023 |
| e | 0.167 | 0.136 |
| g | 0.024 | 0.023 |
| h | 0.024 | 0.023 |
| i | 0.024 | 0.023 |
| l | 0.071 | 0.045 |
| m | 0.024 | 0.023 |
| n | 0.048 | 0.068 |
| o | 0.048 | 0.045 |
| r | 0.024 | 0 |
| s | 0.143 | 0.136 |
| t | 0.048 | 0.091 |
| v | 0.024 | 0.023 |
| w | 0.024 | 0.023 |
| space | 0.190 | 0.180 |
- For binary channels it is possible that the receiver alphabet is the same as the source alphabet where are the symbols. Suppose the source sends a binary image where each pixel is either a 1 or 0 with and . If the channel is noiseless then and and the noise conditional probability . However, if the channel is noisy then the noise probabilities will take effect: resulting in and . We will discuss this later. Deriving these results are part of your theoretical exercise 😁.
- Lastly, the race to select a champion to represent the Philippines will be held this May 2022. Suppose our good citizens (source) have done their part in participating in the elections. Once the ballots are saved, these ballots move to the elections office (channel) for counting. Unfortunately, some evil politician cannot withstand losing. The evil politician bribed (noise) the office to pump up the voting counts for themselves. When the counting finishes, the results turn out to be skewed from what the Filipino nation really chose (receiver). This can be an interesting topic to look into. Can we determine how much noise got into the system?
In summary, the three basic components are the source, channel, and receiver. The source is characterized by some random variable which is also the source alphabet containing the symbols with a probability distribution associated with each outcome. The combinational sequence of symbols creates a message that travels along the channel. The channel is the medium where the message goes through and it is possible that noise can corrupt the message. Some channels can be noiseless where the message will never be corrupted, while some channels can be noisy where some symbols of the source message can be altered or some new symbols can be added to the source message. The receiver retrieves the message at the end of the channel. The receiver is characterized by some random variable also with the receiver alphabet containing the symbols associated to some probability distribution. It is possible for the receiver to receive more symbols than the source (i.e. ). If the channel is noiseless then the receiver will obtain the exact outcomes and distributions ; otherwise, either the outcomes or the probability distributions won't be the same: .
Binary Symmetric Channels
We will focus on binary channels since almost all computer systems use binary representations. One of the most common binary channels is the Binary Symmetric Channel (BSC). Figure 2 shows how we draw BSC trees.
The source alphabet of a BSC is with a probability distribution that models the probability of sending a 1 as and the probability of sending a 0 as . The blue arrows represent the channel probabilities. The probabilities of receiving the incorrect value when a signal is sent are . In other words, this is the probability of receiving a 1 but a 0 is sent or the probability of receiving a 0 but a 1 is sent. Of course, the probability of receiving the correct values when a signal is sent are . Finally, the probability of the received symbols are and . Let's tabulate these probabilities:
| Component | Probability |
|---|---|
We are interested in calculating , , , , and . For now, we'll be ignoring because we are much more interested about the information that appears at the receiver.
Calculating source entropy
Since the input is a simple binary source, we use the Bernoulli entropy . Therefore:
-
(1)
-
Sometimes we prefer to combine terms so that equation 1 is simplified into:
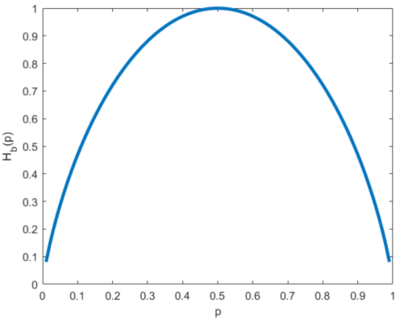
This presents a more elegant equation; however, equation 1 is more preferred if we are to program it. The simplified version has a problem when creating an undefined (or infinite) value for the fraction. Because of this, we prefer to stick with the form of equation 1 so that it's easier to program. For the case of , we can always make an exception in our program to return 0. Recall our "fixed" definition for information. One important observation, an obvious one, is that the source entropy is independent of noise. Therefore the entropy is just dependent on the probability distribution of the source alphabet. Figure 3 shows the Bernoulli entropy curve with varying . We've seen this in our introduction to information theory Wiki page.
Calculating receiver entropy
If you think about it carefully, the receiver side is also a Bernoulli entropy. We know that and . If we let then we can plug it directly into the Bernoulli entropy equation:
-
(2)
-
Expanding this just for completeness results in:
-
(2)
-
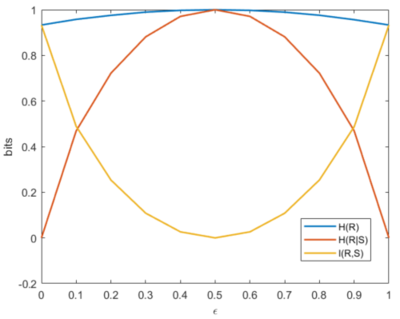
We set equation 2 to be either of the above equations since they're the same. Again, it's simpler to use the former version because we can directly program the equation. Simply find then use a Bernoulli entropy function. It's interesting to see what happens when we vary . Figure 4 shows what happens to when we sweep and parametrize simultaneously. Here are a few interesting observations:
- When , (the thick blue line) observe that . This is expected because no noise means we can retrieve the same information.
- When , (the green line super imposed on the blue line) we can see that too! When it doesn't necessarily mean the noise is at maximum, but rather the noise inverts all 1s to 0s. Essentially, we have the "same" information but all bits are flipped. This is the same as finding the negative form of an image. We have the same information but its representation is inverted.
- When , (the yellow line) we obtain maximum entropy. Regardless of how many 1s and 0s you send over the channel, the bits will always be flipped 50% of the time. This yields maximum uncertainty and the receiver will never understand what it's receiving. For example, suppose the source sends a thousand 1s continuously. But the receiver receives 500 1s and 500 0s. In the receiver's perspective, they wouldn't know what to make of this information.
- When , the entropy trend increases as it gets closer to a flat 1. When the entropy trend decreases on the sides and goes back to the same curve when . In the region where , the uncertainty increases due to increasing noise; however, in the region where , the uncertainty starts to go back because even though the bits are flipped, the inversion seems to maintain the same information.
- Lastly, if you look closely at equation 2, if we sweep (such that it's the x-axis) and we parametrize (where it represents the different curves), we will get the same trends as in figure 4.
Take note of these interpretations for now. We'll demonstrate these using images in a bit.
Calculating noise entropy
We defined conditional entropy as:
We can write this out explicitly to obtain:
We already know:
We need to find , , , and . Simple!
Plugging in the probabilities and simplifying the equations would give:
Lo and behold, the noise entropy is simply the Bernoulli entropy of . Equation 3 shows this and we already know the trend for this.
-
(3)
-
One important observation is that is only dependent on and it is independent of . Any manipulation from the source will never affect the noise. Also, since the noise entropy follows the Bernoulli entropy, then the maximum noise entropy occurs when .
Calculating mutual information
Recall that we can calculate the mutual information by:
-
(4)
-
If you need a review or recap, draw the Venn diagram or refer to module 2 discussion on mutual information. It is better to program this equation after writing the functions for and instead of re-writing the entire equation. However, if you are a masochist and prefer to write down the entire derivation, it's entirely up to you. If we plug in equations 2 and 3 we get:
-
(4)
-
Or you can solve this using our definition of mutual information as:
You should be able to end up with the same equation. We'll use the former equation 4 for our programs because of its simplicity. Figure 5 shows the trend for a BSC while we vary and parametrize . We get some interesting observations and interpretations:
- When , . This makes sense because there is no channel noise. All the information from the source gets to the receiver perfectly. The information about the receiver is contained in the source. In other words, it is the quality of information transmitted across the channel. This is good! You can also visualize this if you draw the Venn diagram where both source and receiver circles are aligned. Interestingly, when , we arrive at the same result! Again, this should be okay since inverting all the bits still maintains the same information.
- When , we mentioned earlier that this produces the peak uncertainty about the received information. Previously, and when . Since both the entropy of the receiver and the noise are the same, then regardless of any at the source. This is expected because, again, if the noise flips the bits 50% of the time, then the receiver cannot even guess what the message is.
- When , when . This indicates that the message gets blurrier with increasing noise. However, when , as . When all the bits are inverted, we maintain the information. Figure 6 shows a rough visualization based on the Venn diagrams.
Calculating mutual information on a per outcome basis
Aside from getting the average mutual information for the entire system, it is noteworthy to investigate the mutual information on a per outcome basis. We write:
-
(5)
-
Equation 5 measures how much mutual information per pairs of receive and send combinations. This has a nice interpretation where is the mutual information about contained in . Again, recall the Venn diagram. For example, tells us the mutual information about contained in .
has the following properties:
- and has a nice interpretation that if the channel is inverted such that the receiver becomes the source and the source becomes the receiver, the information about contained in will be the same information about contained in .
- . Can be derived from equation 5.
- If events and are independent then .
From here we can determine , , , and . Since we know the necessary probabilities we have:
For programming purposes, it's best to separate the logarithmic terms such that:
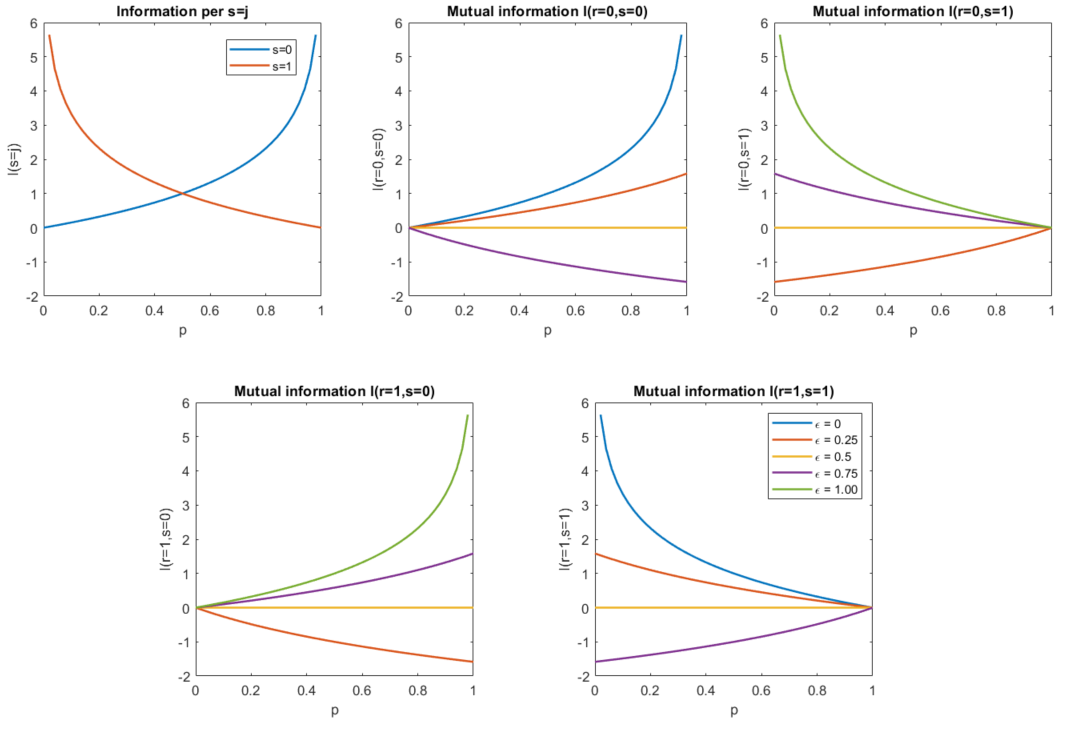
Let's analyze each by looking at equations and observing plots. Figure 7 shows different flavors of plots. Yay plots!😍
Here are some interesting observations and interpretations for each outcome. If it's difficult to see through the plots, go back to the working equations. Sometimes it's easier to see it from there.
- If , then and . This result only means that everything about is contained in (by our definition of mutual information). We also have which means that the noise information does not exist! Observe that these lines do not appear in their respective plots (3rd and 4th plots don't have the blue line).
- If , then we obtain similar results but this time and . This indicates that we have perfect transmission BUT all the information is inverted. In other words, all information about is contained in , and all information about is contained in . On the other hand, and they do not appear in their respective plots (2nd and 5th plots don't have the green line).
- If , then the noise produces maximum uncertainty! Such that . This result implies that there is no information about any outcome that is contained in . It's the flat yellow line in plots 2-5.
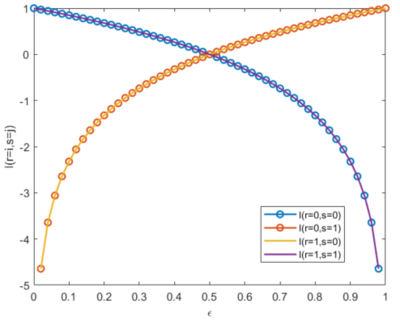
You might wonder why negative information exists? What does it imply? Let's look at a new scenario where we fix and sweep . Figure 8 shows this scenario. We have the following observations and interpretations:
- Both and have the same curves while and have the same curves as well. We expect this result because the channel is symmetric.
- When , both and are negative while and are positive but less than 1. On the other hand, when , things are swapped where both and are now negative and both and are now positive.
- Negative information indicates that the effects of noise are such that all information about the sent symbol has been lost and hence the received symbol is more likely to tell us about the characteristic of the noise rather than the signal being sent.
An alternative way of saying the last bullet is that it is an indicator of how strong the noise is. If and all mutual information of noise (i.e., and ) are negative while all source-receiver mutual information (i.e., and ) are positive, then that means the flipping of bits is not strong enough. At a bird's eye-view this means the receiver would most likely be able to decode the information from the source. However, when , and all mutual information of noise are positive while all source-receiver mutual information are negative, then the strength of flipping bits is stronger. At an extreme case, when , then that means all the bits that go through the channel always flip and the strength of all and terms show a high value.
Calculating joint entropy
Last but not the least, sometimes we are interested in the joint entropy. We can calculate in a practical way by using:
-
(6)
-
Or it could also be:
-
(6)
-
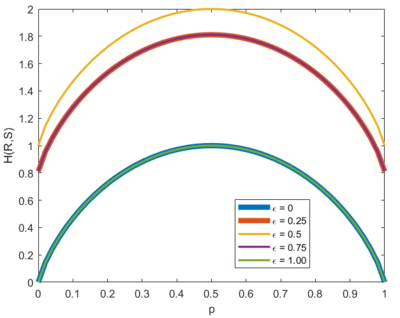
Where we know both and follow the Bernoulli entropies for and , respectively (i.e., and ). Just like the other plots, figure 9 shows the curves for while varying and parametrizing . Here are a few observations:
- Maximum occurs when . When we draw the Venn diagram, this happens when both source and receiver are independent of each other. This also results in which is consistent with our earlier discussions.
- Similar to the earlier discussions, is the same when and . Again, they convey the same information but the bits are inverted when .
- is analogous to containers for information.
Sample Application: Noisy Images
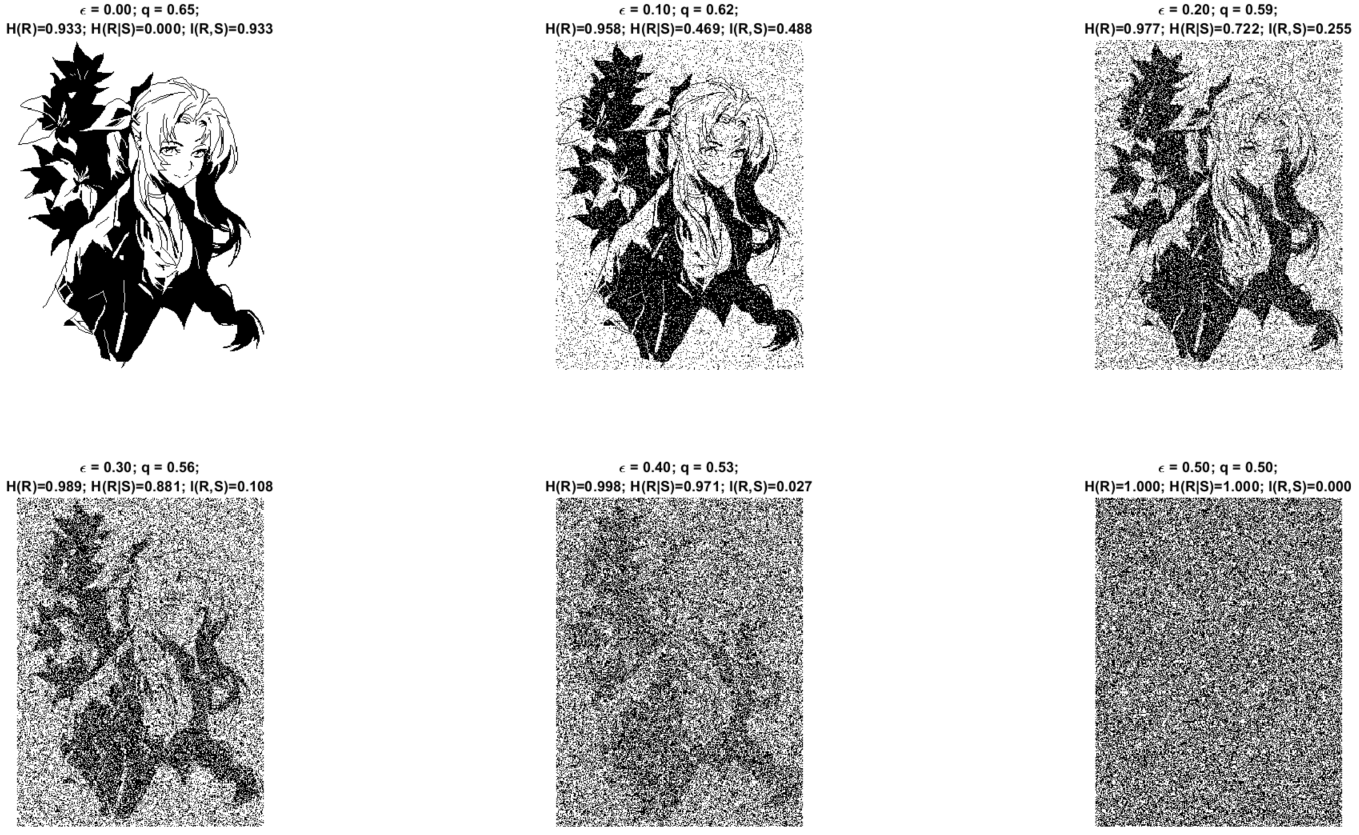
After a rigorous and comprehensive discussion on the mathematical perspective of BSC information, it's time to relate these concepts to something more realizable. We will discuss how BSC affects images. The idea is simple, suppose we have binary image (i.e., pixels are just black and white) and we send them over some BSC with noise . Let's investigate how we can somehow relate our metrics of information to actual data. This should build a bit of intuition and appreciation. Figure 10 shows images of a nice lady (Hooray! Aerith 😍) while we're varying different levels of noise. A clean version of the image has and .
In figure 10, we first demonstrate what happens to the image as . We can easily associate how noise and the effective information translates to what kind of data we are receiving. Moreover we can also show what happens when we push . Figure 11 shows how the images transform from a noisy state to its complete inverted image.
Cool right? We can plot the changes in , , and . Figure 12 shows this. Now, let's put those theories into reality. We have the following interesting observations:
- When , obviously we get the same image and . If this happens then holds true. So we can agree that if there is no noise, the information content of is found in since . Try to embrace this interpretation. It sounds weird but that's what information theory tells us.
- When the image gets noisier to the point that it becomes unrecognizable. Observe that increases and this should makes sense because as noise increases, the data we get at the receiver becomes gibberish. This increases our uncertainty of the received data. The images support this scenario. You could also look at Figure 12 if you prefer the mathematical way. Also, observe how decreases indicating that the information found in decreases until the received image does not represent anything from the source.
- When the image is at its maximum uncertainty! The receiver side will see nothing but a noisy image. Notice that is at its peak, as well as leading to . We should know that is at its peak when because follows the Bernoulli entropy . is also at its peak because we are only getting noisy images at the receiver side.
- When , figure 11 shows that we will eventually get a recognizable image again. Observe that starts to decrease again as well as until it reaches . The same scenario happens when but starting from .
- Finally, when , we obtain a recognizable image! However, the image is now fully inverted. Despite being a negative image, we still maintain the same information from the source such that . Which, again, simply means that the information content at the receiver contained in is the same because .
Summary
Just to have a quick recap of all the details in this page:
- We discussed the basics of a simple channel. We defined the source, channel, and receiver. We also discussed terms like alphabet, symbols, and messages.
- We had a comprehensive study of the binary symmetric channel (BSC) showing how to calculate the probabilities and information. We also analyzed the implications of the derived equations through plots and several philosophical examples.
- Lastly, we finished by relating the BSC to a simple noisy image example. We can thank Aerith Gainsborough for being our model today. Thanks Aerith!
This part is quite heavy, but the we're not done yet! Shannon's theory of information extends further to capacity of channels. Here, we assumed that the channel we're using can send an infinite number of bits second. However, in reality, communication has a limited bandwidth depending on the channel medium. With this limitation, is there a way we can circumvent the channel capacity? In the next module we will explore a teaser of Shannon's source coding theorem. つづく




![{\displaystyle H(S)=p\left[\log _{2}\left({\frac {1-p}{p}}\right)\right]-\log _{2}(1-p)}](https://en.wikipedia.org/api/rest_v1/media/math/render/svg/cdeff8ba880c775d28bc664bcd533b7b2cfebed1)


![{\displaystyle I(R,S)=\left[-(p+\epsilon -2\epsilon p)\log _{2}(p+\epsilon -2\epsilon p)-(1-p-\epsilon +2\epsilon p)\log _{2}(1-p-\epsilon +2\epsilon p)\right]-\left[-\epsilon \log _{2}(\epsilon )-(1-\epsilon )\log _{2}(1-\epsilon )\right]}](https://en.wikipedia.org/api/rest_v1/media/math/render/svg/9779caed445f5cc7438efaf3c4648e028f60323c)


