Difference between revisions of "Engaging introduction to information theory"
Ryan Antonio (talk | contribs) (→A simple case of data compression: finished the discussion on data compression. We need to add the appropriate GIFS later on.) |
Ryan Antonio (talk | contribs) |
||
| (7 intermediate revisions by the same user not shown) | |||
| Line 1: | Line 1: | ||
== What's with information theory? == | == What's with information theory? == | ||
| − | If Newton developed theories for calculus and Einstein developed the theory of relativity, then [https://en.wikipedia.org/wiki/Claude_Shannon Claude Shannon], at par with these mathematical geniuses, developed information theory. In 1948, Claude's published work called "A Mathematical Theory of Communication"<ref>C. E. Shannon, ''A Mathematical Theory of Communication'', The Bell System Technical Journal, Vol. 27, pp. 379–423, 623–656, July, October, 1948. ([http://people.math.harvard.edu/~ctm/home/text/others/shannon/entropy/entropy.pdf pdf])</ref> tells us how to quantify ''information''. | + | If Newton developed theories for calculus and Einstein developed the theory of relativity, then [https://en.wikipedia.org/wiki/Claude_Shannon Claude Shannon], at par with these mathematical geniuses, developed information theory. In 1948, Claude's published work called "A Mathematical Theory of Communication"<ref>C. E. Shannon, ''A Mathematical Theory of Communication'', The Bell System Technical Journal, Vol. 27, pp. 379–423, 623–656, July, October, 1948. ([http://people.math.harvard.edu/~ctm/home/text/others/shannon/entropy/entropy.pdf pdf])</ref> tells us how to quantify ''information''. Based on any dictionary, information can mean knowledge, facts, or a message obtained from investigation, study, or instruction. Information in a mathematical perspective means something similar but with a tiny twist in its definition. Let's take a look at a few examples. Suppose you were told the following: |
| − | |||
| − | |||
# Classes will start next week! | # Classes will start next week! | ||
| Line 11: | Line 9: | ||
Can you identify which statement conveys the most information? Hopefully, you'll pick statement number 2! If you carefully think about it, the first statement is probably something you know already. It has a high probability of happening, but this information isn't new to you. For the second statement, the chance of this happening is almost close to none, and we'll be the most surprised if it does happen! The second statement, ''surprisingly'', has the most information. Lastly, the third statement is just a jumble of letters without structure; therefore, it has no meaning at all. In the perspective of the English language, the third statement has a very low chance of happening because we know very well that this is not how we structure our sentences in English. | Can you identify which statement conveys the most information? Hopefully, you'll pick statement number 2! If you carefully think about it, the first statement is probably something you know already. It has a high probability of happening, but this information isn't new to you. For the second statement, the chance of this happening is almost close to none, and we'll be the most surprised if it does happen! The second statement, ''surprisingly'', has the most information. Lastly, the third statement is just a jumble of letters without structure; therefore, it has no meaning at all. In the perspective of the English language, the third statement has a very low chance of happening because we know very well that this is not how we structure our sentences in English. | ||
| − | + | The example above tells us something about information. Information consists of ''surprise'' and ''meaning''. In this class, we are more interested in the surprise part of information because that is something that we can measure. There are two motivations for this <ref> D. Applebaum, ''Probability and Information: An Integrated Approach'', Cambridge University Press, 2008. </ref>: (1) Originally, Shannon's information theory was developed for communication systems, and 'surprise' was more relevant. (2) Meaning or ''semantics'' are challenging problems. We won't discuss meaning for now but for those interested you might want to check out the branch of artificial intelligence called [https://en.wikipedia.org/wiki/Natural_language_processing ''natural language processing'' (NLP)]. The above example is oversimplified, but it should give you a glimpse of what we expect when studying information theory. Let's take a look at a few more interesting examples. | |
| − | |||
| − | The example above tells us something about information. Information consists of ''surprise'' and ''meaning''. In this class, we are more interested in the surprise part of information because that is something that we can measure. There are two motivations for this <ref> D. Applebaum, ''Probability and Information: An Integrated Approach'', Cambridge University Press, 2008. </ref>: (1) | ||
=== A tale of 2<sup>n</sup> paths === | === A tale of 2<sup>n</sup> paths === | ||
| Line 20: | Line 16: | ||
| − | [[File:Eight questions.png| | + | [[File:Eight questions.png|right|400px|thumb| Figure 1: Binary tree showing how each question leads to a specific item. ]] |
| − | In | + | In Figure 1, all arrows that point up are 'yes' while all arrows that point down are 'no'. Let's say our ideal set of questions would be: |
# Q1 - Is it a vehicle? | # Q1 - Is it a vehicle? | ||
| Line 28: | Line 24: | ||
# Q3 - Does it carry things? | # Q3 - Does it carry things? | ||
| − | We get one step closer to the correct answer for every question. Since the questions are answerable only by yes or no, we always obtain a 'bit' of information (pun intended). For example, when we asked Q1, and the answerer responded with a yes, we now have 1 bit of information. That information tells us that we are thinking of a vehicle. When we asked Q2, we received another bit of information. That information tells us that the automobile is small. Finally, when we get to Q3, we receive another bit of information again. If you were asked to repeat the game, you would still ask 3 questions that lead to one of the 8 possible answers. In principle, each question you ask halves the number of possible answers as depicted in | + | We get one step closer to the correct answer for every question. Since the questions are answerable only by yes or no, we always obtain a 'bit' of information (pun intended). For example, when we asked Q1, and the answerer responded with a yes, we now have 1 bit of information. That information tells us that we are thinking of a vehicle. When we asked Q2, we received another bit of information. That information tells us that the automobile is small. Finally, when we get to Q3, we receive another bit of information again. If you were asked to repeat the game, you would still ask 3 questions that lead to one of the 8 possible answers. In principle, each question you ask halves the number of possible answers as depicted in Figure 1. As the guesser, each answer has an equal 'surprise' for you, but it is beneficial because each response gives you information! Are you starting to see a pattern now? |
| Line 38: | Line 34: | ||
=== A simple case of data compression === | === A simple case of data compression === | ||
| − | Information theory was developed in the context of communication. The original problem it tries to solve is how to maximize the transmission of data over some channel. Let's try to understand this through a simple example. Imagine that some guy | + | Information theory was developed in the context of communication <ref>Stone, J.V. , ''Information Theory: A Tutorial Introduction'', Sebtel Press, 2015. </ref>. The original problem it tries to solve is how to maximize the transmission of data over some channel. Let's try to understand this through a simple example. Imagine that some guy named Bob wants to express his love for Alice, who lives miles away. Since a picture is worth a thousand words and Bob decides to go the extra mile, he sends an [https://www.youtube.com/watch?v=UOS5CP8tzYQ&ab_channel=AzulSierra-Filmscoring animated video] with 1080p quality running at 30 frames per second (FPS). For now, let's assume that their only means of communication is through a satellite with very little bandwidth (i.e., satellite communication can only transfer 19.2 million bit/s). The GIF below shows a cute animation of this. |
| − | + | [[File:Bob alice nodencode.gif|center]] | |
| + | Let's do a bit of math. Each frame of the video is one image. Each image consists of three color channels: RGB. Each color channel consists of <math> 1920 \times 1080 </math> pixel dimensions, and each pixel ranges from <math> 0 - 255 </math> which is equivalent to <math> \log_2(255) = 8 </math> bits per pixel. In total, one image consists of <math> 3 \times 1920 \times 1080 \times 8 = 49,766,400 </math> bits of information. Moreover, the video runs in 30 FPS so the rate of data that needs to be transmitted over the satellite channel is <math> 30 \times 49,766,400 \approx 1.5 \times 10^9 </math> or <math> 1.5 \ \textrm{billion} </math> bits per second. Clearly, 30 images per second cannot fit in the satellite channel that can only support 19.2 million bit/s. If this happens, Alice needs to buffer the images on her side (i.e., wait a bit until the entire video has loaded). Since Bob wants to make sure that Alice would get the best quality and experience, he decides to study CoE 161 and learn about data compression. After hours of dedication and hard work, Bob developed an ''encoder'' that reduces the video so that Alice does not need to wait for buffering. When Bob designed his encoder (and of course the accompanying decoder), his primary considerations was to squeeze out redundant data (information) in the video. | ||
| − | + | [[File:Color pallette example.PNG|900px|thumb|center|Figure 2: Color example that may show spatial redundancy. Some colors may be invisible to the human eyes.]] | |
| + | There is redundant information in both space and time in any video. For example, adjacent pixels in a video may look the same. Sometimes a block of pixels of the same color may go together. Instead of sending each pixel value, we can just send coordinates of that block in an equation form. Adjacent pixels with similar colors in space can be ''spatially'' redundant, and this offers an opportunity to reduce the representations. Figure 2, shows a color palette. In some cases, videos may also have a gradient of colors where the difference between the next gradient can potentially be represented with less number of bits. This is what they call [https://en.wikipedia.org/wiki/Delta_encoding difference encoding]. When it comes to time, ''temporal'' redundancy may be in the form of changes in pixels for each frame. For example, the onion skin image in Figure 3 demonstrates how pixel artists animate the succeeding frames. The pixels in an animation change positions over time. We do not need to send the entire image again. We could, instead, send out the change in pixel position or change in color because these differences can be represented with fewer bits. Overall, any spatial or temporal redundancy can be squeezed out depending on the characteristics of the original data. In doing so, we can reduce the representation for the entire video. | ||
| − | + | [[File:Onion skin example.PNG|thumb|right| Figure 3: Onion skin for pixel animations. For every change in frame, some pixels stay the same. Temporal redundancy exists in this example.]] | |
| − | |||
| + | When Bob made his encoder and decoder, he was able to impressively compress the video without any loss of information. This is called ''lossless compression''. There exist ''lossy compression'' algorithms but these try to maintain 99% data integrity. Alice can enjoy the video without buffering. The GIF below demonstrates this. You might ask, doesn't it take time to process the data through the encoder and decoder? Yes, it does take time, but in several cases, the encoding and decoding processes are several magnitudes faster than having to communicate huge chunks of data through a channel. The only cost is the complexity of the encoding and decoding algorithm. We'll get back to this in the latter part of this course. | ||
| − | [[File: | + | [[File:Bob alice w encode.gif|center|Bob sending an encoded message to Alice.]] |
| − | + | Where does information theory come in? Well, it comes in the redundancy part. When objects and symbols appear too frequently, then we expect those data to appear. Less surprising data provide good opportunities to be reduced or encoded differently. More surprising data are those that need to be given more attention to. Later in the course, we will encounter ''source coding'' which compresses data based on the probability distribution. | |
| − | + | {{Note| Data compression is a hot topic especially for multimedia streaming sites like [https://en.wikipedia.org/wiki/YouTube Youtube] and [https://en.wikipedia.org/wiki/Netflix Netflix]. Both of them use complex yet efficient [https://en.wikipedia.org/wiki/Codec codecs]. You may look into [https://research.netflix.com/research-area/video-encoding-and-quality Netflix's research] website where they display some interesting white papers and video discussions. |reminder}} | |
| − | + | === Information theory to measure complexity === | |
| − | + | [[File:Measuring complexity.png|thumb|400px|Figure 4: Measuring complexity (from [https://www.slideserve.com/cala/measuring-complexity Ron Eglash, RPI]).]] | |
| + | For any system we are studying, designing, or building, an interesting and important question is usually: "How complex is this system?" or "How complex should this system be?". In general, we want to be able to compare two systems, and be able to say that one system is more complex than the other. In this case, having a numerical metric would be very convenient. | ||
| − | + | Possible ways of measuring complexity (obviously not a complete list!): | |
| + | # Human observation, thus making any kind of rating subjective. | ||
| + | # Complexity based on the number of parts, components, or distinct elements. However, this depends on the definition of what is a "part". This is dependent on the observer's scale, from functional components down to atoms at the extreme case, as shown in Figure 4. | ||
| + | # Number of dimensions. This is sometimes hard to measure, e.g. degrees of freedom, etc. | ||
| + | # Number of parameters controlling the system. | ||
| + | # The minimal description needed. However, we need to figure out which language we need to use. | ||
| + | # Information content. We then need to figure out how to define and measure information. | ||
| + | # Minimum generator or constructor (to build the system). We need to define what tools and methods we need to use to build the system. | ||
| + | # Minimum energy and/or time to construct the system. However, some systems evolve with time, so defining the beginning and end points can be difficult. | ||
| − | + | All of these measures are associated with a ''model'' of the system in question. Thus observers could use different models, and therefore come up with different notions of the complexity of the said system. We do not expect to come up with a ''single'' universal measure of complexity, but we can explore a framework that is optimal for (a) a particular observer, (b) a particular context, and (c) a particular purpose. Let us focus on the measures related to how ''unexpected'' an observation is, an approach known as '''Information Theory'''. | |
| − | == | + | == Odd one out! == |
| + | [[File:Odd ball.PNG|thumb|right|Figure 5: Weighing scale and 12 oddballs.]] | ||
| − | + | Let's do a simple thought experiment <ref> Thouless, Robert H. ''The 12-Balls Problem as an Illustration of the Application of Information Theory.'' The Mathematical Gazette, vol. 54, no. 389, Mathematical Association, 1970 </ref>. Figure 5 shows a weighing scale and 12 identical-looking balls. 11 of these balls are of the same weight but one ball has a different weight. You don't know if the odd ball is heavier or lighter. Your task is to find the oddball by using the weighing scale. You may dump as many balls as you need. What is the least number of times you need to use the weighing scale to find the odd ball? A solution can be found [https://www.youtube.com/watch?v=y5VdtQSqiAI&t=2650s&ab_channel=JakobFoerster here]. You'll need to listen to Professor David Mackay's lectures first. | |
| − | == | ||
== References == | == References == | ||
Latest revision as of 17:39, 17 February 2022
Contents
What's with information theory?
If Newton developed theories for calculus and Einstein developed the theory of relativity, then Claude Shannon, at par with these mathematical geniuses, developed information theory. In 1948, Claude's published work called "A Mathematical Theory of Communication"[1] tells us how to quantify information. Based on any dictionary, information can mean knowledge, facts, or a message obtained from investigation, study, or instruction. Information in a mathematical perspective means something similar but with a tiny twist in its definition. Let's take a look at a few examples. Suppose you were told the following:
- Classes will start next week!
- The entire semester will be suspended due to the pandemic!
- AEKG EAKJGRALGN EAFKEA EAFFH
Can you identify which statement conveys the most information? Hopefully, you'll pick statement number 2! If you carefully think about it, the first statement is probably something you know already. It has a high probability of happening, but this information isn't new to you. For the second statement, the chance of this happening is almost close to none, and we'll be the most surprised if it does happen! The second statement, surprisingly, has the most information. Lastly, the third statement is just a jumble of letters without structure; therefore, it has no meaning at all. In the perspective of the English language, the third statement has a very low chance of happening because we know very well that this is not how we structure our sentences in English.
The example above tells us something about information. Information consists of surprise and meaning. In this class, we are more interested in the surprise part of information because that is something that we can measure. There are two motivations for this [2]: (1) Originally, Shannon's information theory was developed for communication systems, and 'surprise' was more relevant. (2) Meaning or semantics are challenging problems. We won't discuss meaning for now but for those interested you might want to check out the branch of artificial intelligence called natural language processing (NLP). The above example is oversimplified, but it should give you a glimpse of what we expect when studying information theory. Let's take a look at a few more interesting examples.
A tale of 2n paths
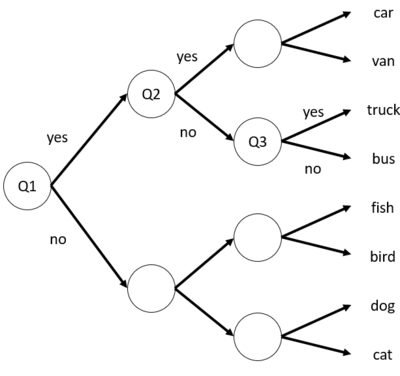
When you were young, you've probably come across a game called Pinoy Henyo. Pinoy Henyo was an iconic game in the Philippines consisting of two players: (1) a guesser and (2) an answerer. The guesser will have a random word stuck on his forehead, and only the answerer can see the word. The word could be an object, thing, place, or person. The goal is that the guesser asks a series of questions to which the answerer can only respond with a yes or no until the guesser can correctly guess the word. In other countries this game is also called twenty questions. Let's try to constrain the game to three questions only, and let's assume that the guesser and answerer know the eight possible words. The goal is to guess the word that the answerer thought of. Consider the figure below that shows possible paths to the correct.
In Figure 1, all arrows that point up are 'yes' while all arrows that point down are 'no'. Let's say our ideal set of questions would be:
- Q1 - Is it a vehicle?
- Q2 - Is the size small?
- Q3 - Does it carry things?
We get one step closer to the correct answer for every question. Since the questions are answerable only by yes or no, we always obtain a 'bit' of information (pun intended). For example, when we asked Q1, and the answerer responded with a yes, we now have 1 bit of information. That information tells us that we are thinking of a vehicle. When we asked Q2, we received another bit of information. That information tells us that the automobile is small. Finally, when we get to Q3, we receive another bit of information again. If you were asked to repeat the game, you would still ask 3 questions that lead to one of the 8 possible answers. In principle, each question you ask halves the number of possible answers as depicted in Figure 1. As the guesser, each answer has an equal 'surprise' for you, but it is beneficial because each response gives you information! Are you starting to see a pattern now?
Our simple three-question example tells us that it takes questions to come up with different answers. In the case of the twenty questions game, we can arrive at different possible outcomes. This is an extreme number. The Pinoy Henyo game is more challenging because we have no idea how many questions do we need yet the challenge is to get to the final answer with the least number of questions or at least until time runs out. In information theory, we are interested in "what question would give me the highest information?". If you carefully think about it, in Pinoy Henyo, you would like your partner (i.e., answerer) to actually give you a yes rather than a no. The context looks different because we're expecting so many 'no's because we know that most of our questions may not be useful. However, when we receive a 'yes' it becomes surprising because it gives us valuable information. Doesn't this sound familiar with our oversimplified example above? Think about it.
A simple case of data compression
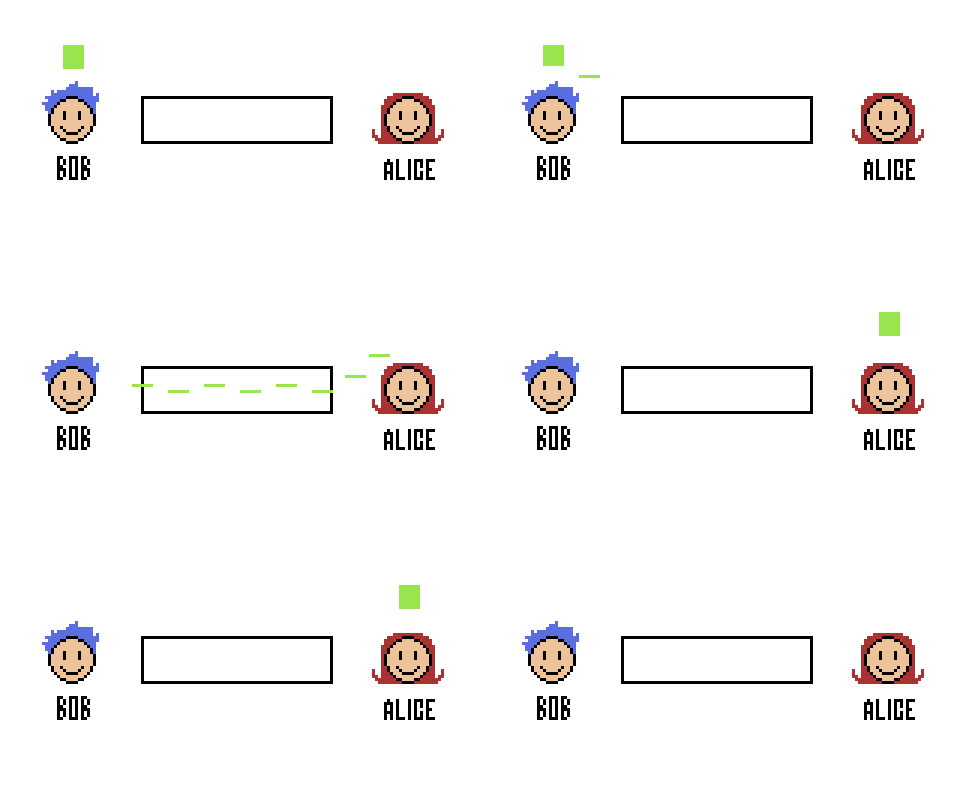
Information theory was developed in the context of communication [3]. The original problem it tries to solve is how to maximize the transmission of data over some channel. Let's try to understand this through a simple example. Imagine that some guy named Bob wants to express his love for Alice, who lives miles away. Since a picture is worth a thousand words and Bob decides to go the extra mile, he sends an animated video with 1080p quality running at 30 frames per second (FPS). For now, let's assume that their only means of communication is through a satellite with very little bandwidth (i.e., satellite communication can only transfer 19.2 million bit/s). The GIF below shows a cute animation of this.
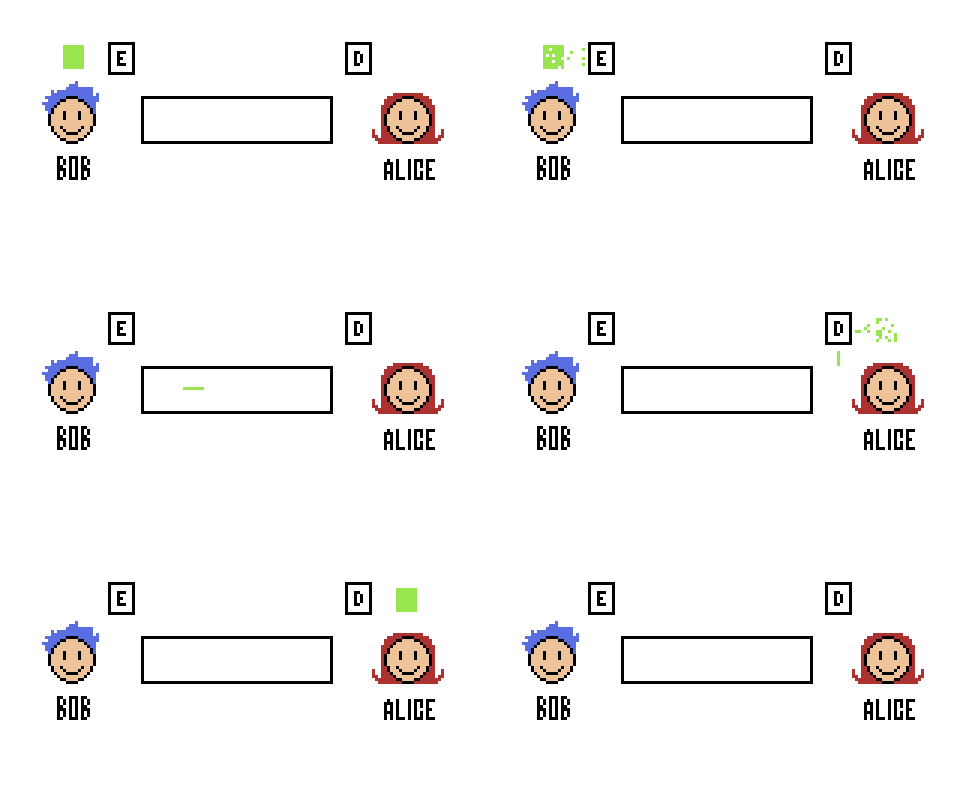
Let's do a bit of math. Each frame of the video is one image. Each image consists of three color channels: RGB. Each color channel consists of pixel dimensions, and each pixel ranges from which is equivalent to bits per pixel. In total, one image consists of bits of information. Moreover, the video runs in 30 FPS so the rate of data that needs to be transmitted over the satellite channel is or bits per second. Clearly, 30 images per second cannot fit in the satellite channel that can only support 19.2 million bit/s. If this happens, Alice needs to buffer the images on her side (i.e., wait a bit until the entire video has loaded). Since Bob wants to make sure that Alice would get the best quality and experience, he decides to study CoE 161 and learn about data compression. After hours of dedication and hard work, Bob developed an encoder that reduces the video so that Alice does not need to wait for buffering. When Bob designed his encoder (and of course the accompanying decoder), his primary considerations was to squeeze out redundant data (information) in the video.
There is redundant information in both space and time in any video. For example, adjacent pixels in a video may look the same. Sometimes a block of pixels of the same color may go together. Instead of sending each pixel value, we can just send coordinates of that block in an equation form. Adjacent pixels with similar colors in space can be spatially redundant, and this offers an opportunity to reduce the representations. Figure 2, shows a color palette. In some cases, videos may also have a gradient of colors where the difference between the next gradient can potentially be represented with less number of bits. This is what they call difference encoding. When it comes to time, temporal redundancy may be in the form of changes in pixels for each frame. For example, the onion skin image in Figure 3 demonstrates how pixel artists animate the succeeding frames. The pixels in an animation change positions over time. We do not need to send the entire image again. We could, instead, send out the change in pixel position or change in color because these differences can be represented with fewer bits. Overall, any spatial or temporal redundancy can be squeezed out depending on the characteristics of the original data. In doing so, we can reduce the representation for the entire video.
When Bob made his encoder and decoder, he was able to impressively compress the video without any loss of information. This is called lossless compression. There exist lossy compression algorithms but these try to maintain 99% data integrity. Alice can enjoy the video without buffering. The GIF below demonstrates this. You might ask, doesn't it take time to process the data through the encoder and decoder? Yes, it does take time, but in several cases, the encoding and decoding processes are several magnitudes faster than having to communicate huge chunks of data through a channel. The only cost is the complexity of the encoding and decoding algorithm. We'll get back to this in the latter part of this course.
Where does information theory come in? Well, it comes in the redundancy part. When objects and symbols appear too frequently, then we expect those data to appear. Less surprising data provide good opportunities to be reduced or encoded differently. More surprising data are those that need to be given more attention to. Later in the course, we will encounter source coding which compresses data based on the probability distribution.
Information theory to measure complexity

For any system we are studying, designing, or building, an interesting and important question is usually: "How complex is this system?" or "How complex should this system be?". In general, we want to be able to compare two systems, and be able to say that one system is more complex than the other. In this case, having a numerical metric would be very convenient.
Possible ways of measuring complexity (obviously not a complete list!):
- Human observation, thus making any kind of rating subjective.
- Complexity based on the number of parts, components, or distinct elements. However, this depends on the definition of what is a "part". This is dependent on the observer's scale, from functional components down to atoms at the extreme case, as shown in Figure 4.
- Number of dimensions. This is sometimes hard to measure, e.g. degrees of freedom, etc.
- Number of parameters controlling the system.
- The minimal description needed. However, we need to figure out which language we need to use.
- Information content. We then need to figure out how to define and measure information.
- Minimum generator or constructor (to build the system). We need to define what tools and methods we need to use to build the system.
- Minimum energy and/or time to construct the system. However, some systems evolve with time, so defining the beginning and end points can be difficult.
All of these measures are associated with a model of the system in question. Thus observers could use different models, and therefore come up with different notions of the complexity of the said system. We do not expect to come up with a single universal measure of complexity, but we can explore a framework that is optimal for (a) a particular observer, (b) a particular context, and (c) a particular purpose. Let us focus on the measures related to how unexpected an observation is, an approach known as Information Theory.
Odd one out!
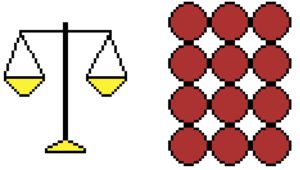
Let's do a simple thought experiment [4]. Figure 5 shows a weighing scale and 12 identical-looking balls. 11 of these balls are of the same weight but one ball has a different weight. You don't know if the odd ball is heavier or lighter. Your task is to find the oddball by using the weighing scale. You may dump as many balls as you need. What is the least number of times you need to use the weighing scale to find the odd ball? A solution can be found here. You'll need to listen to Professor David Mackay's lectures first.
References
- ↑ C. E. Shannon, A Mathematical Theory of Communication, The Bell System Technical Journal, Vol. 27, pp. 379–423, 623–656, July, October, 1948. (pdf)
- ↑ D. Applebaum, Probability and Information: An Integrated Approach, Cambridge University Press, 2008.
- ↑ Stone, J.V. , Information Theory: A Tutorial Introduction, Sebtel Press, 2015.
- ↑ Thouless, Robert H. The 12-Balls Problem as an Illustration of the Application of Information Theory. The Mathematical Gazette, vol. 54, no. 389, Mathematical Association, 1970
